Fortrade Canada Ltd. as an order-execution only dealer is not permitted to provide you with any advice or recommendations. These Market Commentaries should not be construed as a recommendation, advice or any attempt by Fortrade Canada Ltd. to prompt or influence you in making an investment decision to purchase, sell, hold or exchange any security or to influence the timing of such activity. This content is produced by Fortrade Limited which is not registered in any capacity with any securities regulatory authority in Canada.
71% of retail investor accounts lose money when trading CFDs with this provider.
CFDs are complex instruments and come with a high risk of losing money rapidly due to leverage. 71% of retail investor accounts lose money when trading CFDs with this provider. You should consider whether you understand how CFDs work and whether you can afford to take the high risk of losing your money.
70.41% of retail investor accounts lose money when trading CFDs with this provider.
CFDs are complex instruments and come with a high risk of losing money rapidly due to leverage. 70.41% of retail investor accounts lose money when trading CFDs with this provider. You should consider whether you understand how CFDs work and whether you can afford to take the high risk of losing all your money. Read full risk warning.
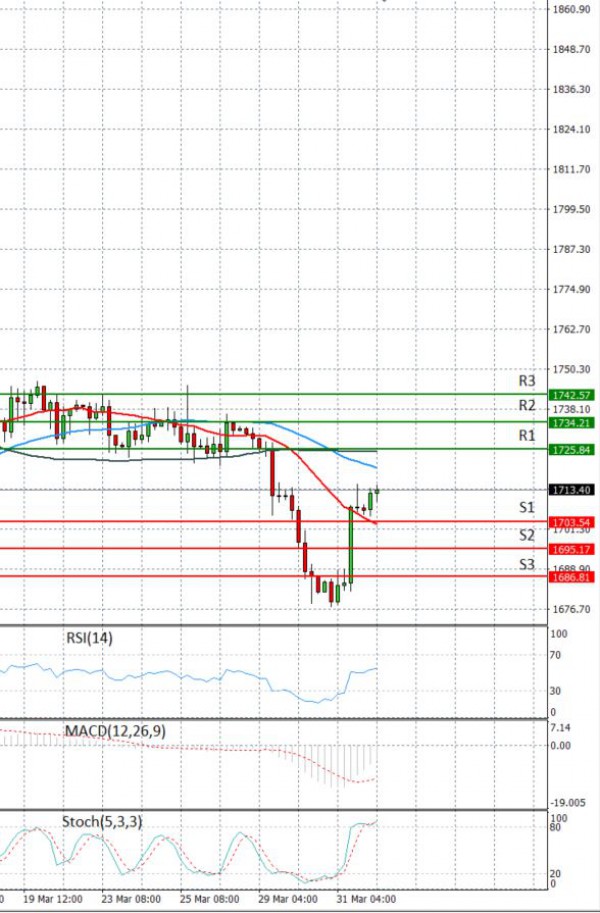
EU Session Analysis for CFD Instruments 01/04/2021
Fundamental analysis
01 April, 2021
Gold bounced back on Thursday from a three-week low hit in the previous session, as the U.S. dollar and Treasury yields eased, while President Joe Biden's $2 trillion-plus jobs plan further supported the metal's appeal as a hedge against inflation. The dollar index pulled back after hitting a five-month high on Wednesday, making gold less expensive for holders of other currencies. Biden announced his second multitrillion-dollar legislative proposal in two months in office, including $621 billion to rebuild infrastructure. Gold is seen as a hedge against higher inflation that could follow stimulus measures, but a recent spike in U.S. Treasury yields has weighed on the non-yielding commodity. Gold found its bottom on Wednesday and rallied sharply off its lowest level since June. Technical indicators had shown the safe haven yellow metal was in an oversold state.