CFDs are complex instruments and come with a high risk of losing money rapidly due to leverage. 71% of retail investor accounts lose money when trading CFDs with this provider. You should consider whether you understand how CFDs work and whether you can afford to take the high risk of losing your money.
CFDs are complex instruments and come with a high risk of losing money rapidly due to leverage. 70.91% of retail investor accounts lose money when trading CFDs with this provider. You should consider whether you understand how CFDs work and whether you can afford to take the high risk of losing all your money. Read full risk warning.

Crude Oil Analysis

EU Session Analysis for CFD Instruments 11/01/2022

Fundamental analysis

11 January, 2022

Oil prices climbed on Tuesday, with investors regaining some risk appetite as they await clues from the U.S. Federal Reserve chairman on potential interest rate rises and as some oil producers continued to struggle to beef up output. A weaker U.S. dollar helped support oil prices on Tuesday, as it makes oil cheaper for those holding other currencies. Analysts pointed to OPEC supply additions running below their allowed increase under the OPEC+ pact, as some countries, including Nigeria, are not producing their agreed volumes. Libya, which is exempt from OPEC supply curbs, has been hit by pipeline maintenance work and oil field disruptions. However on Monday, production resumed at the El Feel oil field, where an armed group halted output last month. The market is waiting on U.S. oil and product inventory data from the American Petroleum Institute (API), an industry group, due at 2130 GMT on Tuesday, followed by data from the U.S. Energy Information Administration on Wednesday. Six analysts polled by Reuters expect U.S. crude stockpiles fell by about 2 million barrels in the week to Jan. 7, which would mark a seventh straight week of declining crude inventories.
Technical analysis

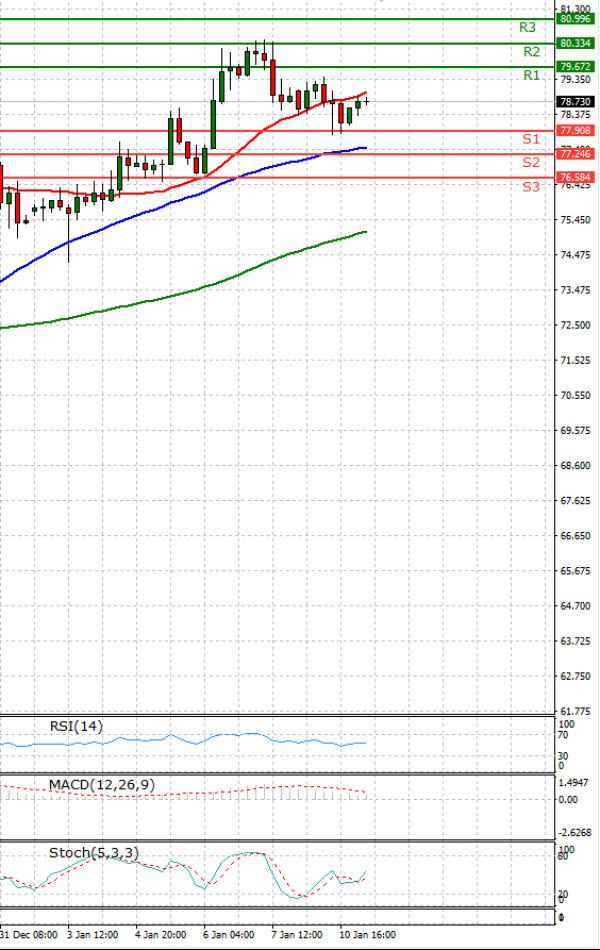
Crude Oil Analysis Technical analysis 11/01/2022
Time Frame: 1 hour

CRUDEOIL Support & Resistance Table - 11/01/2022

Support & Resistance Level Explanation
Resistance 2 80.334 Daily R2
Resistance 1 79.672 Daily R1
Support 1 77.908 Daily S1
Support 2 77.246 Daily S2

CRUDEOIL Indicator Table - 11/01/2022

Indicator Signal
SMA 20 Sell
SMA 50 Buy
SMA 100 Buy
MACD( 12;26;9) Buy
RSI (14) Buy
Stochastic ( 9;6;3) Buy

CRUDEOIL Indicator / Period Table - 11/01/2022

Indicator / Period Day - BuyWeek - BuyMonth - Buy
MACD( 12;26;9) Buy BuyBuy
RSI (14) Buy BuyBuy
SMA 20 Sell BuyBuy

CRUDEOIL 11/01/2022 - Reference Price : 78.790

Buy
Simple Moving AverageBuy (2)Sell (1)
Technical Indicators - OscillatorsBuy (3)Sell (0)
Share It With Your Network
Crude OIL Chart
Update Time: -
Highest
Lowest
1M 5M H D W
Prices are loading..
Ready for trading?Start Now