Fortrade Canada Ltd. as an order-execution only dealer is not permitted to provide you with any advice or recommendations. These Market Commentaries should not be construed as a recommendation, advice or any attempt by Fortrade Canada Ltd. to prompt or influence you in making an investment decision to purchase, sell, hold or exchange any security or to influence the timing of such activity. This content is produced by Fortrade Limited which is not registered in any capacity with any securities regulatory authority in Canada.
69% of retail investor accounts lose money when trading CFDs with this provider.
CFDs are complex instruments and come with a high risk of losing money rapidly due to leverage. 69% of retail investor accounts lose money when trading CFDs with this provider. You should consider whether you understand how CFDs work and whether you can afford to take the high risk of losing your money.
67.52% of retail investor accounts lose money when trading CFDs with this provider.
CFDs are complex instruments and come with a high risk of losing money rapidly due to leverage. 67.52% of retail investor accounts lose money when trading CFDs with this provider. You should consider whether you understand how CFDs work and whether you can afford to take the high risk of losing all your money. Read full risk warning.
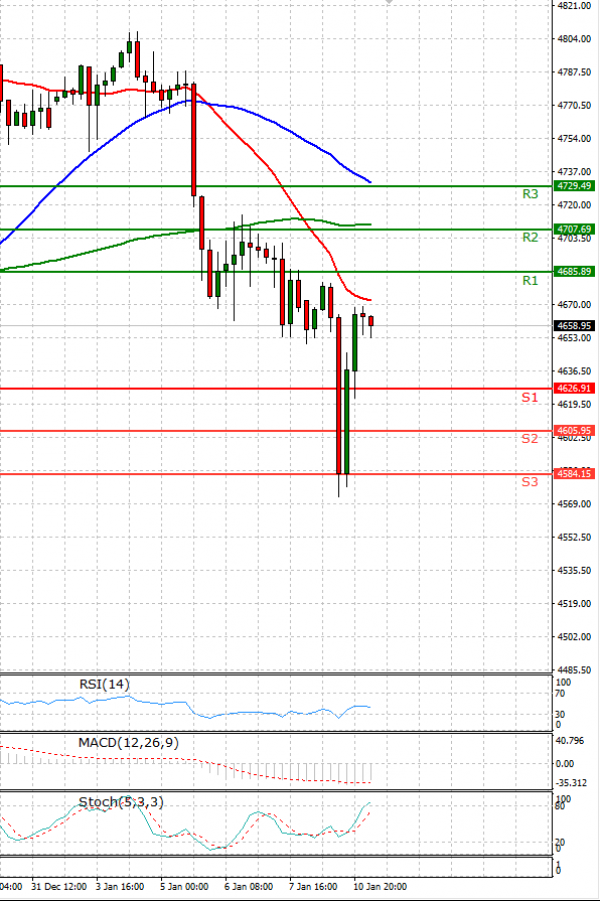
EU Session Analysis for CFD Instruments 11/01/2022
Fundamental analysis
11 January, 2022
U.S. stocks ended down but well off their lows of the day, with the Nasdaq staging a furious comeback late in the session as some investors appeared to be hunting for bargains even as they worried about rising interest rates. With Nasdaq paring its losses sharply during the session some investors were showing up looking for bargains after the sharp sell-off earlier in the day. Traders have ramped up their rate hike expectations since the Fed's minutes from the December meeting appeared to signal an earlier-than-expected rate rise. Goldman Sachs said it expects the Fed to raise rates four times in 2022, compared to its previous forecast of three.