CFDs are complex instruments and come with a high risk of losing money rapidly due to leverage. 70% of retail investor accounts lose money when trading CFDs with this provider. You should consider whether you understand how CFDs work and whether you can afford to take the high risk of losing your money.
CFDs are complex instruments and come with a high risk of losing money rapidly due to leverage. 70.41% of retail investor accounts lose money when trading CFDs with this provider. You should consider whether you understand how CFDs work and whether you can afford to take the high risk of losing all your money. Read full risk warning.

Crude Oil Analysis

EU Session Analysis for CFD Instruments 31/01/2022

Fundamental analysis

31 January, 2022

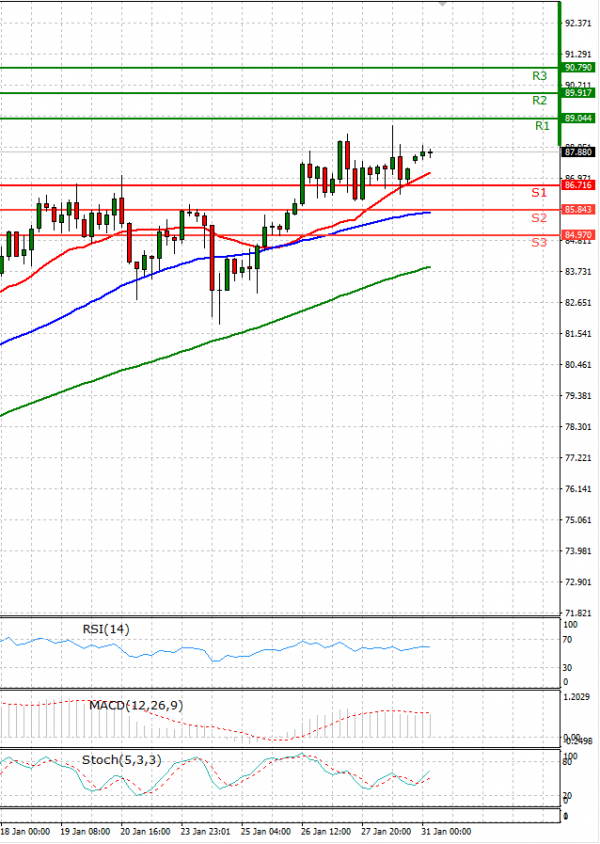
Oil rose more than 1% on Monday to near 7-year highs hit in the previous session, while supply concerns and political tensions in Eastern Europe and the Middle East put prices on track for their biggest monthly gain in almost a year. The benchmarks recorded their highest levels since October 2014 on Friday, $91.70 and $88.84, respectively, and their sixth straight weekly gain. They were headed for about 17% gains this month, the most since February 2021. At its Feb. 2 meeting, OPEC+ is likely to stick with a planned rise in its oil output target for March, several OPEC+ sources told Reuters. Tensions between Russia and the West have also underpinned crude prices. Russia, the world’s second-largest oil producer, and the West have been at loggerheads over Ukraine, fanning fears that energy supplies to Europe could be disrupted. The head of NATO said on Sunday that Europe needs to diversify its energy supplies as Britain warned it was “highly likely” that Russia was looking to invade Ukraine. The market is on alert over the Middle East situation too after the United Arab Emirates said it had intercepted a ballistic missile fired by Yemen’s Houthi as the Gulf state hosted Israel’s President Isaac Herzogin first such visit.

Technical analysis

Crude Oil Analysis Technical analysis 31/01/2022
Time Frame: 1 hour

CRUDEOIL Support & Resistance Table - 31/01/2022

Support & Resistance Level Explanation
Resistance 2 89.917 Daily R2
Resistance 1 89.044 Daily R1
Support 1 86.716 Daily S1
Support 2 85.843 Daily S2

CRUDEOIL Indicator Table - 31/01/2022

Indicator Signal
SMA 20 Buy
SMA 50 Buy
SMA 100 Buy
MACD( 12;26;9) Buy
RSI (14) Buy
Stochastic ( 9;6;3) Buy

CRUDEOIL Indicator / Period Table - 31/01/2022

Indicator / Period Day - BuyWeek - BuyMonth - Buy
MACD( 12;26;9) Buy BuyBuy
RSI (14) Buy BuyBuy
SMA 20 Buy BuyBuy

CRUDEOIL 31/01/2022 - Reference Price : 87.880

Buy
Simple Moving AverageBuy (3)Sell (0)
Technical Indicators - OscillatorsBuy (3)Sell (0)
Share It With Your Network
Crude OIL Chart
Update Time: -
Highest
Lowest
1M 5M H D W
Prices are loading..
Ready for trading?Start Now