Fortrade Canada Ltd. as an order-execution only dealer is not permitted to provide you with any advice or recommendations. These Market Commentaries should not be construed as a recommendation, advice or any attempt by Fortrade Canada Ltd. to prompt or influence you in making an investment decision to purchase, sell, hold or exchange any security or to influence the timing of such activity. This content is produced by Fortrade Limited which is not registered in any capacity with any securities regulatory authority in Canada.
70% of retail investor accounts lose money when trading CFDs with this provider.
CFDs are complex instruments and come with a high risk of losing money rapidly due to leverage. 70% of retail investor accounts lose money when trading CFDs with this provider. You should consider whether you understand how CFDs work and whether you can afford to take the high risk of losing your money.
70.41% of retail investor accounts lose money when trading CFDs with this provider.
CFDs are complex instruments and come with a high risk of losing money rapidly due to leverage. 70.41% of retail investor accounts lose money when trading CFDs with this provider. You should consider whether you understand how CFDs work and whether you can afford to take the high risk of losing all your money. Read full risk warning.
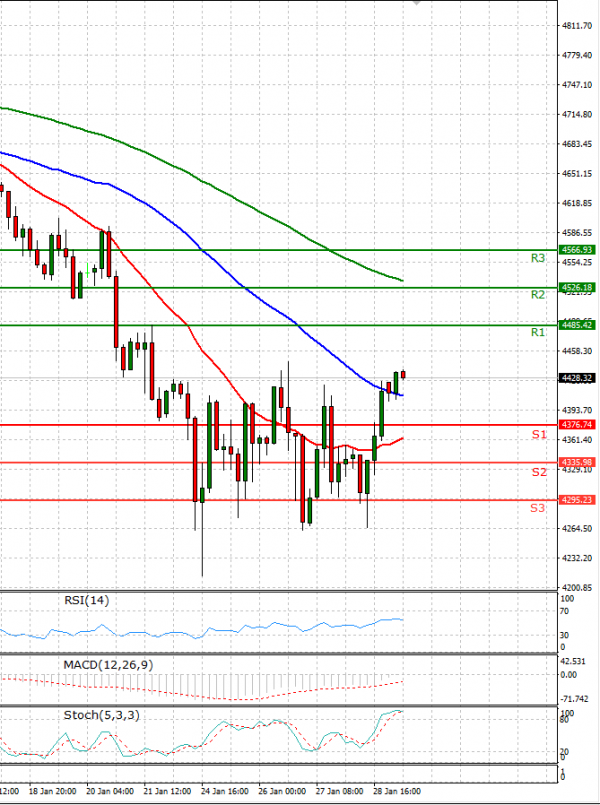
EU Session Analysis for CFD Instruments 31/01/2022
Fundamental analysis
31 January, 2022
Wall Street surged on Friday, notching its best day so far in 2022 after another zigzag session, ending a tumultuous week marked by mixed corporate earnings, geopolitical turmoil and an increasingly aggressive Federal Reserve. All three major U.S. stock indexes began the day in the red, but turned increasingly green as the session progressed, with tech shares doing the heaviest lifting. The S&P 500 and the Dow posted gains from last Friday's close, but the Nasdaq was essentially flat on the week, capping five days of topsy-turvy trading.