Fortrade Canada Ltd. as an order-execution only dealer is not permitted to provide you with any advice or recommendations. These Market Commentaries should not be construed as a recommendation, advice or any attempt by Fortrade Canada Ltd. to prompt or influence you in making an investment decision to purchase, sell, hold or exchange any security or to influence the timing of such activity. This content is produced by Fortrade Limited which is not registered in any capacity with any securities regulatory authority in Canada.
69% of retail investor accounts lose money when trading CFDs with this provider.
CFDs are complex instruments and come with a high risk of losing money rapidly due to leverage. 69% of retail investor accounts lose money when trading CFDs with this provider. You should consider whether you understand how CFDs work and whether you can afford to take the high risk of losing your money.
67.52% of retail investor accounts lose money when trading CFDs with this provider.
CFDs are complex instruments and come with a high risk of losing money rapidly due to leverage. 67.52% of retail investor accounts lose money when trading CFDs with this provider. You should consider whether you understand how CFDs work and whether you can afford to take the high risk of losing all your money. Read full risk warning.
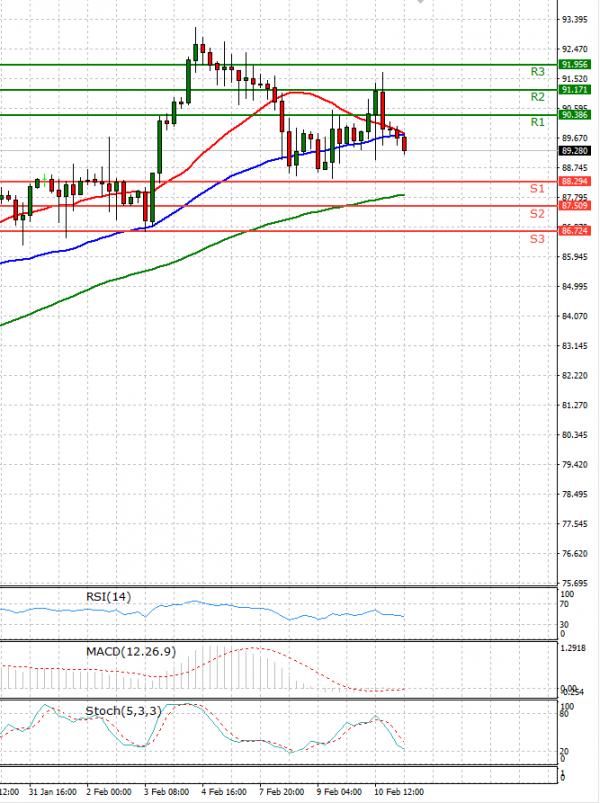
EU Session Analysis for CFD Instruments 11/02/2022
Fundamental analysis
11 February, 2022
Oil prices eased on Friday as hot U.S. inflation fanned worries about aggressive interest rate hikes and investors await the outcome of U.S.-Iran talks that could lead to increased global crude supply. St. Louis Federal Reserve Bank President James Bullard had said he wanted a full percentage point of interest rate hikes by July 1, following the release of U.S. inflation data that saw its biggest annual increase in 40 years. Investors have also been eyeing indirect talks between the United States and Iran to revive a nuclear deal, which resumed this week after a 10-day break. A deal could see the lifting of sanctions on Iranian oil and ease global supply tightness. White House spokeswoman Jen Psaki said the talks have "reached an urgent point," and that a "deal that addresses the core concerns of all sides is in sight." Meanwhile, the Organization of the Petroleum Exporting Countries (OPEC) said that world oil demand might rise even more steeply this year. The group forecast a gain of 4.15 million barrels per day (bpd) this year, as the global economy posts a strong recovery from the pandemic.