Fortrade Canada Ltd. as an order-execution only dealer is not permitted to provide you with any advice or recommendations. These Market Commentaries should not be construed as a recommendation, advice or any attempt by Fortrade Canada Ltd. to prompt or influence you in making an investment decision to purchase, sell, hold or exchange any security or to influence the timing of such activity. This content is produced by Fortrade Limited which is not registered in any capacity with any securities regulatory authority in Canada.
69% of retail investor accounts lose money when trading CFDs with this provider.
CFDs are complex instruments and come with a high risk of losing money rapidly due to leverage. 69% of retail investor accounts lose money when trading CFDs with this provider. You should consider whether you understand how CFDs work and whether you can afford to take the high risk of losing your money.
67.52% of retail investor accounts lose money when trading CFDs with this provider.
CFDs are complex instruments and come with a high risk of losing money rapidly due to leverage. 67.52% of retail investor accounts lose money when trading CFDs with this provider. You should consider whether you understand how CFDs work and whether you can afford to take the high risk of losing all your money. Read full risk warning.
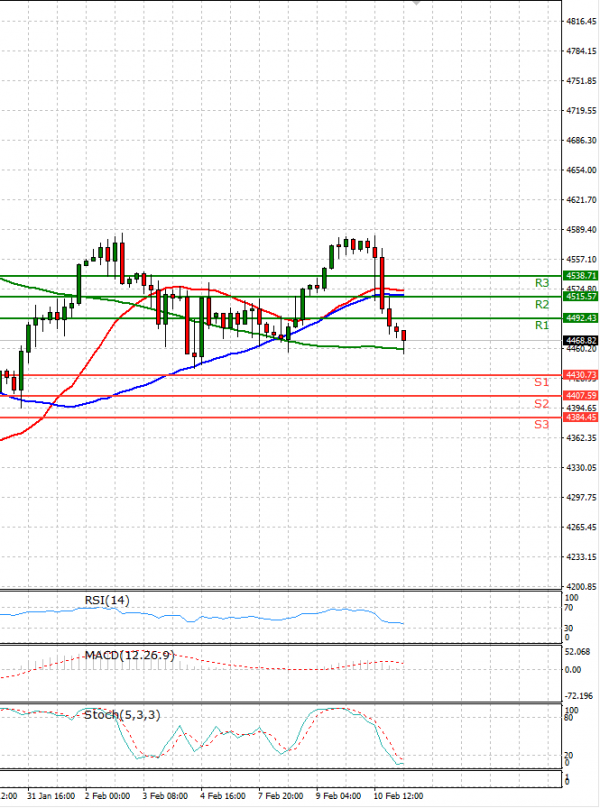
EU Session Analysis for CFD Instruments 11/02/2022
Fundamental analysis
11 February, 2022
Wall Street ended sharply lower on Thursday after U.S. consumer prices data came in hotter than expected and subsequent comments from a Federal Reserve official raised fears the U.S. central bank will hike rates aggressively to fight inflation. US Labor Department data showed consumer prices surged 7.5 percent last month on a year-over-year basis, topping economists’ estimates of 7.3 percent and marking the biggest annual increase in inflation in 40 years. US stocks fell further after St. Louis Federal Reserve Bank President James Bullard said the data had made him “dramatically” more hawkish. Bullard, a voting member of the Fed’s rate-setting committee this year, said he now wanted a full percentage point of interest rate hikes by July 1.