CFDs are complex instruments and come with a high risk of losing money rapidly due to leverage. 70% of retail investor accounts lose money when trading CFDs with this provider. You should consider whether you understand how CFDs work and whether you can afford to take the high risk of losing your money.
CFDs are complex instruments and come with a high risk of losing money rapidly due to leverage. 70.41% of retail investor accounts lose money when trading CFDs with this provider. You should consider whether you understand how CFDs work and whether you can afford to take the high risk of losing all your money. Read full risk warning.

Crude Oil Analysis

EU Session Analysis for CFD Instruments 25/02/2022

Fundamental analysis

25 February, 2022

Oil prices jumped nearly 3% on Friday as Russia's invasion of Ukraine stoked global supply concerns as markets brace for the potential impact of trade sanctions on major crude exporter Russia. The attack on Ukraine caused prices to surge to more than $100 a barrel for the first time since 2014 on Thursday, with Brent touching $105, before paring gains by the close of trade. The massed Russian assault by land, sea and air was the biggest attack on a European state since World War Two, prompting tens of thousands of people to flee their homes. In response to the invasion, U.S. President Joe Biden hit Russia with a wave of sanctions on Thursday, measures that impede Russia's ability to do business in major currencies along with sanctions against banks and state-owned enterprises. Britain, Japan, Canada, Australia and the European Union also unveiled more sanctions on Moscow, including a move by Germany to halt an $11 billion gas pipeline from Russia. The U.S. and Iran have been engaged in indirect nuclear talks in Vienna, in which a deal could lead to the removal of sanctions on Iranian oil sales and increase global supply. Iranian officials said on Twitter on Thursday that Western partners in the nuclear talks have to make decisions on crucial issues to help reach an agreement.
Technical analysis

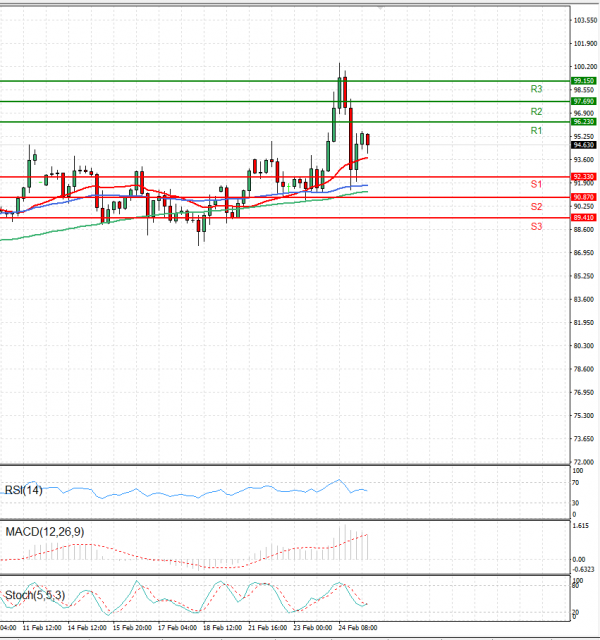
Crude Oil Analysis Technical analysis 25/02/2022
Time Frame: 1 hour

CRUDEOIL Support & Resistance Table - 25/02/2022

Support & Resistance Level Explanation
Resistance 2 97.69 Daily R2
Resistance 1 96.23 Daily R1
Support 1 92.33 Daily S1
Support 2 90.87 Daily S2

CRUDEOIL Indicator Table - 25/02/2022

Indicator Signal
SMA 20 Buy
SMA 50 Buy
SMA 100 Buy
MACD( 12;26;9) Sell
RSI (14) Buy
Stochastic ( 9;6;3) Buy

CRUDEOIL Indicator / Period Table - 25/02/2022

Indicator / Period Day - BuyWeek - BuyMonth - Buy
MACD( 12;26;9) Sell BuyBuy
RSI (14) Buy BuyBuy
SMA 20 Buy BuyBuy

CRUDEOIL 25/02/2022 - Reference Price : 94.63

Buy
Simple Moving AverageBuy (3)Sell (0)
Technical Indicators - OscillatorsBuy (2)Sell (1)
Share It With Your Network
Crude OIL Chart
Update Time: -
Highest
Lowest
1M 5M H D W
Prices are loading..
Ready for trading?Start Now