Fortrade Canada Ltd. as an order-execution only dealer is not permitted to provide you with any advice or recommendations. These Market Commentaries should not be construed as a recommendation, advice or any attempt by Fortrade Canada Ltd. to prompt or influence you in making an investment decision to purchase, sell, hold or exchange any security or to influence the timing of such activity. This content is produced by Fortrade Limited which is not registered in any capacity with any securities regulatory authority in Canada.
70% of retail investor accounts lose money when trading CFDs with this provider.
CFDs are complex instruments and come with a high risk of losing money rapidly due to leverage. 70% of retail investor accounts lose money when trading CFDs with this provider. You should consider whether you understand how CFDs work and whether you can afford to take the high risk of losing your money.
70.41% of retail investor accounts lose money when trading CFDs with this provider.
CFDs are complex instruments and come with a high risk of losing money rapidly due to leverage. 70.41% of retail investor accounts lose money when trading CFDs with this provider. You should consider whether you understand how CFDs work and whether you can afford to take the high risk of losing all your money. Read full risk warning.
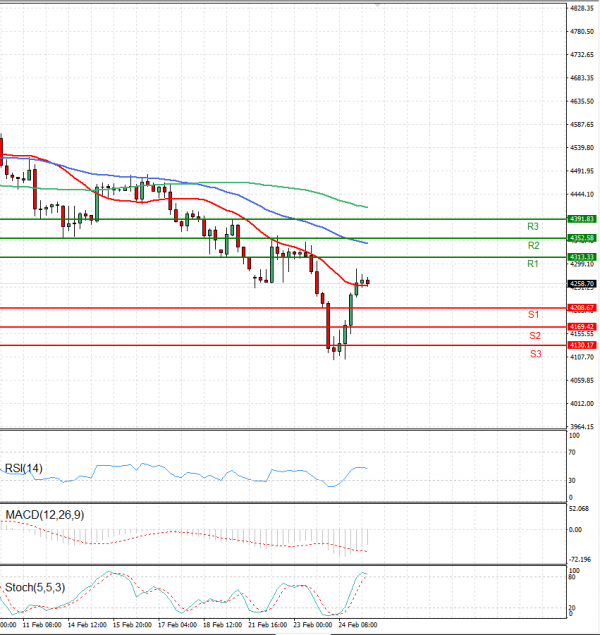
EU Session Analysis for CFD Instruments 25/02/2022
Fundamental analysis
25 February, 2022
The Nasdaq and S&P 500 ended sharply higher on Thursday in a dramatic reversal from the start of the session as U.S. President Joe Biden unveiled harsh new sanctions against Russia after Moscow began an all-out invasion of Ukraine. After consulting counterparts from the Group of Seven nations, Biden announced measures to impede Russia's ability to do business in the world's major currencies, along with sanctions against banks and state-owned enterprises. Indexes, which sold off at the start of the day on news of Russia's invasion of Ukraine, hit session highs in the wake of Biden's comments. Nasdaq was down more than 3% at the open and other indexes opened sharply lower.