Fortrade Canada Ltd. as an order-execution only dealer is not permitted to provide you with any advice or recommendations. These Market Commentaries should not be construed as a recommendation, advice or any attempt by Fortrade Canada Ltd. to prompt or influence you in making an investment decision to purchase, sell, hold or exchange any security or to influence the timing of such activity. This content is produced by Fortrade Limited which is not registered in any capacity with any securities regulatory authority in Canada.
69% of retail investor accounts lose money when trading CFDs with this provider.
CFDs are complex instruments and come with a high risk of losing money rapidly due to leverage. 69% of retail investor accounts lose money when trading CFDs with this provider. You should consider whether you understand how CFDs work and whether you can afford to take the high risk of losing your money.
67.52% of retail investor accounts lose money when trading CFDs with this provider.
CFDs are complex instruments and come with a high risk of losing money rapidly due to leverage. 67.52% of retail investor accounts lose money when trading CFDs with this provider. You should consider whether you understand how CFDs work and whether you can afford to take the high risk of losing all your money. Read full risk warning.
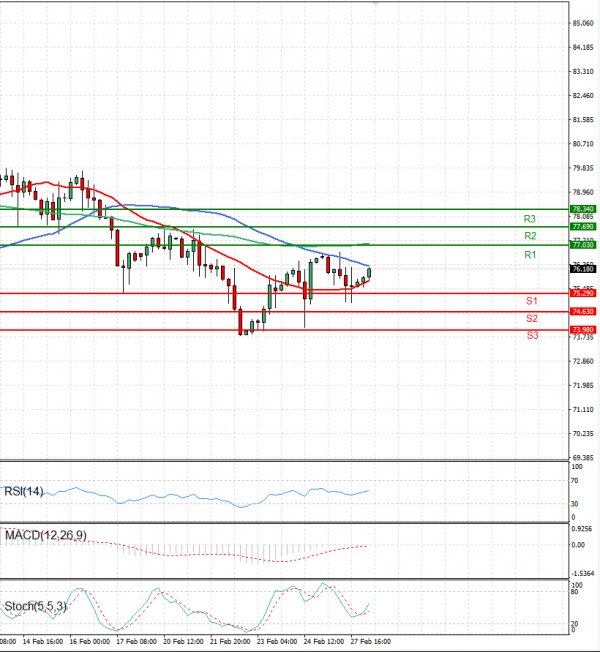
EU Session Analysis for CFD Instruments 28/02/2023
Fundamental analysis
28 February, 2023
Oil prices were steady in Asian trade on Tuesday, supported by hopes a solid economic rebound in China will drive up fuel demand, offsetting worries about further U.S. interest rate hikes potentially hurting demand in the world's biggest economy. Expectations of a demand recovery in China underpinned gains, with the market awaiting key data over the next two days. Economists polled by Reuters expected factory activity in the world's second-largest economy grew in February. A preliminary Reuters poll showed analysts expected crude stocks grew by 400,000 barrels in the week to Feb. 24, which would mark the tenth consecutive week of builds.