Fortrade Canada Ltd. as an order-execution only dealer is not permitted to provide you with any advice or recommendations. These Market Commentaries should not be construed as a recommendation, advice or any attempt by Fortrade Canada Ltd. to prompt or influence you in making an investment decision to purchase, sell, hold or exchange any security or to influence the timing of such activity. This content is produced by Fortrade Limited which is not registered in any capacity with any securities regulatory authority in Canada.
69% of retail investor accounts lose money when trading CFDs with this provider.
CFDs are complex instruments and come with a high risk of losing money rapidly due to leverage. 69% of retail investor accounts lose money when trading CFDs with this provider. You should consider whether you understand how CFDs work and whether you can afford to take the high risk of losing your money.
67.52% of retail investor accounts lose money when trading CFDs with this provider.
CFDs are complex instruments and come with a high risk of losing money rapidly due to leverage. 67.52% of retail investor accounts lose money when trading CFDs with this provider. You should consider whether you understand how CFDs work and whether you can afford to take the high risk of losing all your money. Read full risk warning.
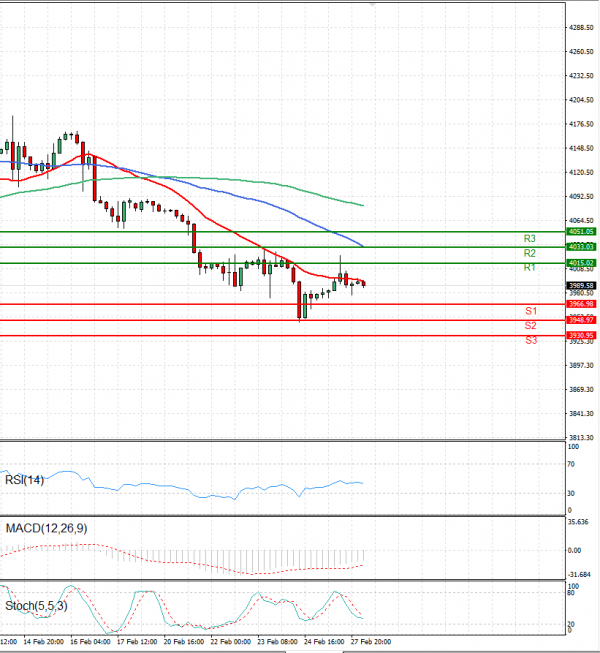
EU Session Analysis for CFD Instruments 28/02/2023
Fundamental analysis
28 February, 2023
U.S. stocks eked out a slight gain on Monday as investors engaged in some bargain hunting after last week's losses, the biggest percentage declines of 2023 for Wall Street's main benchmarks, as jitters persisted about coming interest rate hikes to tame stubbornly high inflation. Economists at UK-based banks Barclays and NatWest believe the Fed could ramp up the pace of its interest-rate rises in March with a half-point hike. Morgan Stanley said it no longer sees a cut by the Fed this year and expects a slower pace of 25 basis points when the central bank does begin lowering rates. Easing yields helped growth stocks rebound while Tesla jumped after the electric automaker said its plant in Brandenburg near Berlin was producing 4,000 cars a week, three weeks ahead of schedule according to a recent production plan reviewed by Reuters.