CFDs are complex instruments and come with a high risk of losing money rapidly due to leverage. 70% of retail investor accounts lose money when trading CFDs with this provider. You should consider whether you understand how CFDs work and whether you can afford to take the high risk of losing your money.
CFDs are complex instruments and come with a high risk of losing money rapidly due to leverage. 67.52% of retail investor accounts lose money when trading CFDs with this provider. You should consider whether you understand how CFDs work and whether you can afford to take the high risk of losing all your money. Read full risk warning.

Crude Oil Analysis

EU Session Analysis for CFD Instruments 20/09/2023

Fundamental analysis

20 September, 2023

Oil prices retreated further from 10-month highs on Wednesday ahead of the U.S. Federal Reserve's interest rate decision, with investors uncertain when peak rates will be hit and how much of an impact it will have on energy demand. Prices fell despite a bigger-than-expected draw in U.S. oil stockpiles and weak U.S. shale output that indicated tight crude supply for the rest of 2023. Investors are awaiting a raft of central bank interest rate decisions this week, including one by the U.S. Federal Reserve on Wednesday, to assess the outlook for economic growth and fuel demand. U.S. crude oil stockpiles fell last week by about 5.25 million barrels, according to market sources citing American Petroleum Institute figures on Tuesday. Analysts in a Reuters poll had expected a 2.2 million-barrel decline. On supply, Exxon Mobil Corp has pledged additional oil production of nearly 40,000 barrels per day in Nigeria in a new investment push in the country, a presidential spokesperson said on Tuesday, citing Exxon's president of global upstream operations.
Technical analysis

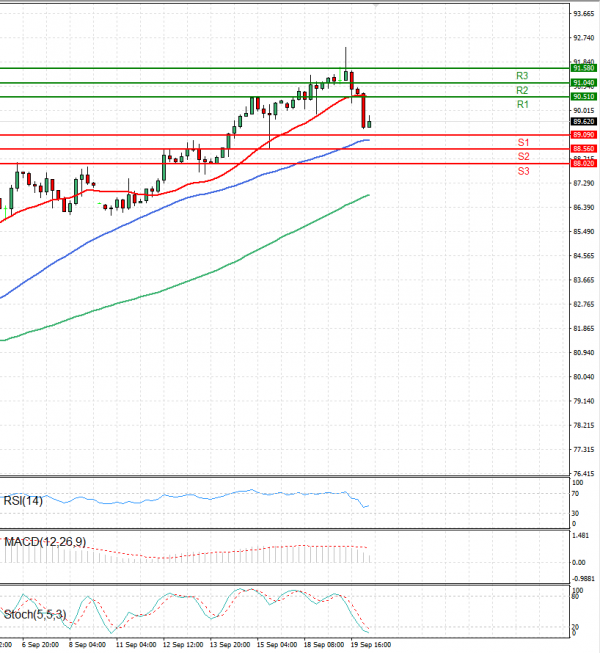
Crude Oil Analysis Technical analysis 20/09/2023
Time Frame: 1 hour

CRUDEOIL Support & Resistance Table - 20/09/2023

Support & Resistance Level Explanation
Resistance 2 91.04 Daily R2
Resistance 1 90.51 Daily R1
Support 1 89.09 Daily S1
Support 2 88.56 Daily S2

CRUDEOIL Indicator Table - 20/09/2023

Indicator Signal
SMA 20 Sell
SMA 50 Buy
SMA 100 Buy
MACD( 12;26;9) Buy
RSI (14) Buy
Stochastic ( 9;6;3) Sell

CRUDEOIL Indicator / Period Table - 20/09/2023

Indicator / Period Day - BuyWeek - BuyMonth - Buy
MACD( 12;26;9) Buy BuyBuy
RSI (14) Buy BuyBuy
SMA 20 Sell BuyBuy

CRUDEOIL 20/09/2023 - Reference Price : 89.62

Buy
Simple Moving AverageBuy (2)Sell (1)
Technical Indicators - OscillatorsBuy (2)Sell (1)
Share It With Your Network
Crude OIL Chart
Update Time: -
Highest
Lowest
1M 5M H D W
Prices are loading..
Ready for trading?Start Now