Fortrade Canada Ltd. as an order-execution only dealer is not permitted to provide you with any advice or recommendations. These Market Commentaries should not be construed as a recommendation, advice or any attempt by Fortrade Canada Ltd. to prompt or influence you in making an investment decision to purchase, sell, hold or exchange any security or to influence the timing of such activity. This content is produced by Fortrade Limited which is not registered in any capacity with any securities regulatory authority in Canada.
70% of retail investor accounts lose money when trading CFDs with this provider.
CFDs are complex instruments and come with a high risk of losing money rapidly due to leverage. 70% of retail investor accounts lose money when trading CFDs with this provider. You should consider whether you understand how CFDs work and whether you can afford to take the high risk of losing your money.
67.52% of retail investor accounts lose money when trading CFDs with this provider.
CFDs are complex instruments and come with a high risk of losing money rapidly due to leverage. 67.52% of retail investor accounts lose money when trading CFDs with this provider. You should consider whether you understand how CFDs work and whether you can afford to take the high risk of losing all your money. Read full risk warning.
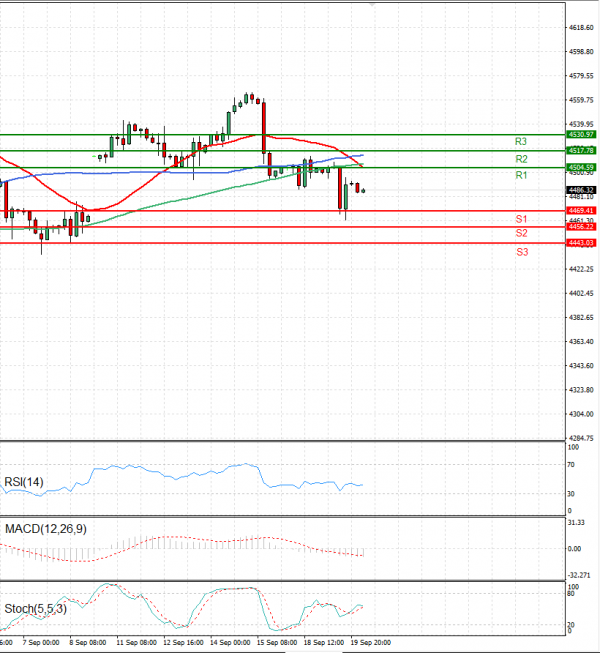
EU Session Analysis for CFD Instruments 20/09/2023
Fundamental analysis
20 September, 2023
Wall Street lost ground on Tuesday, with risk-off sentiment weighing as the U.S. Federal Reserve convened for its much-anticipated two-day monetary policy meeting. All three indexes ended the session lower in a broad sell-off ahead of the Fed's interest rate announcement on Wednesday, which is expected to culminate in a decision to leave key interest rates unchanged. The Fed is also due to release its Summary Economic Projections, including its dot plot, which should provide a glimpse into the Federal Open Markets Committee's forecast trajectory of interest rates, inflation and economic growth.