Fortrade Canada Ltd. as an order-execution only dealer is not permitted to provide you with any advice or recommendations. These Market Commentaries should not be construed as a recommendation, advice or any attempt by Fortrade Canada Ltd. to prompt or influence you in making an investment decision to purchase, sell, hold or exchange any security or to influence the timing of such activity. This content is produced by Fortrade Limited which is not registered in any capacity with any securities regulatory authority in Canada.
69% of retail investor accounts lose money when trading CFDs with this provider.
CFDs are complex instruments and come with a high risk of losing money rapidly due to leverage. 69% of retail investor accounts lose money when trading CFDs with this provider. You should consider whether you understand how CFDs work and whether you can afford to take the high risk of losing your money.
67.52% of retail investor accounts lose money when trading CFDs with this provider.
CFDs are complex instruments and come with a high risk of losing money rapidly due to leverage. 67.52% of retail investor accounts lose money when trading CFDs with this provider. You should consider whether you understand how CFDs work and whether you can afford to take the high risk of losing all your money. Read full risk warning.
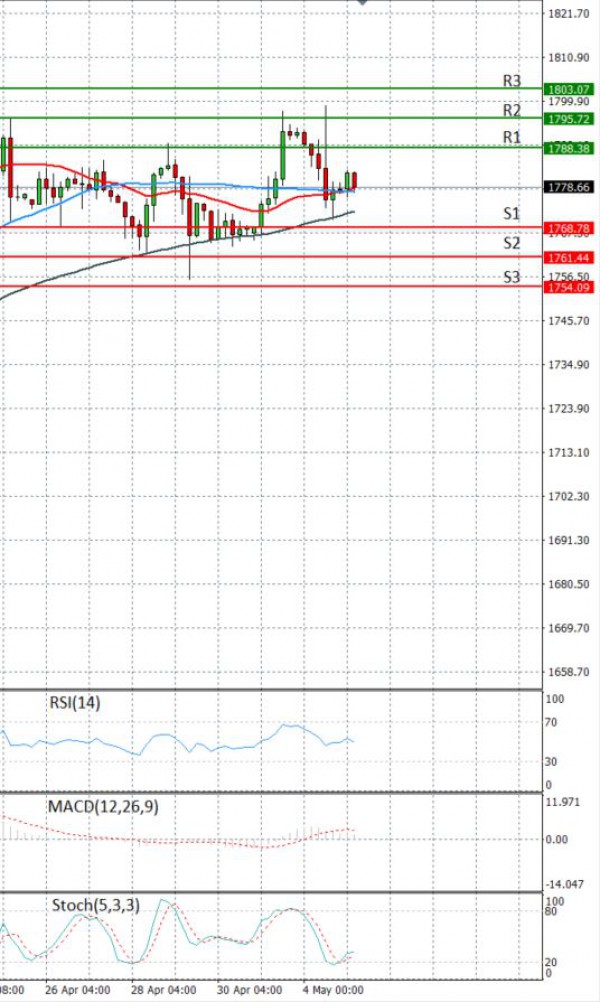
EU Session Analysis for CFD Instruments 05/05/2021
Fundamental analysis
05 May, 2021
Gold prices ticked up on Wednesday, lifted by a retreat in the dollar, although gains were kept in check after U.S. Treasury Secretary Janet Yellen said interest rates may need to rise. The dollar index was down 0.1% against its rivals after scaling a near two-week peak in the previous session. Gold prices fell more than 1% on Tuesday after Yellen said she sees no inflation problem brewing, downplaying earlier comments that rate hikes may be needed to stop the economy overheating as President Joe Biden’s spending plans boost growth. Higher interest rates dull gold’s appeal as it increases the opportunity cost of holding non-yielding bullion.