Fortrade Canada Ltd. as an order-execution only dealer is not permitted to provide you with any advice or recommendations. These Market Commentaries should not be construed as a recommendation, advice or any attempt by Fortrade Canada Ltd. to prompt or influence you in making an investment decision to purchase, sell, hold or exchange any security or to influence the timing of such activity. This content is produced by Fortrade Limited which is not registered in any capacity with any securities regulatory authority in Canada.
69% of retail investor accounts lose money when trading CFDs with this provider.
CFDs are complex instruments and come with a high risk of losing money rapidly due to leverage. 69% of retail investor accounts lose money when trading CFDs with this provider. You should consider whether you understand how CFDs work and whether you can afford to take the high risk of losing your money.
67.52% of retail investor accounts lose money when trading CFDs with this provider.
CFDs are complex instruments and come with a high risk of losing money rapidly due to leverage. 67.52% of retail investor accounts lose money when trading CFDs with this provider. You should consider whether you understand how CFDs work and whether you can afford to take the high risk of losing all your money. Read full risk warning.
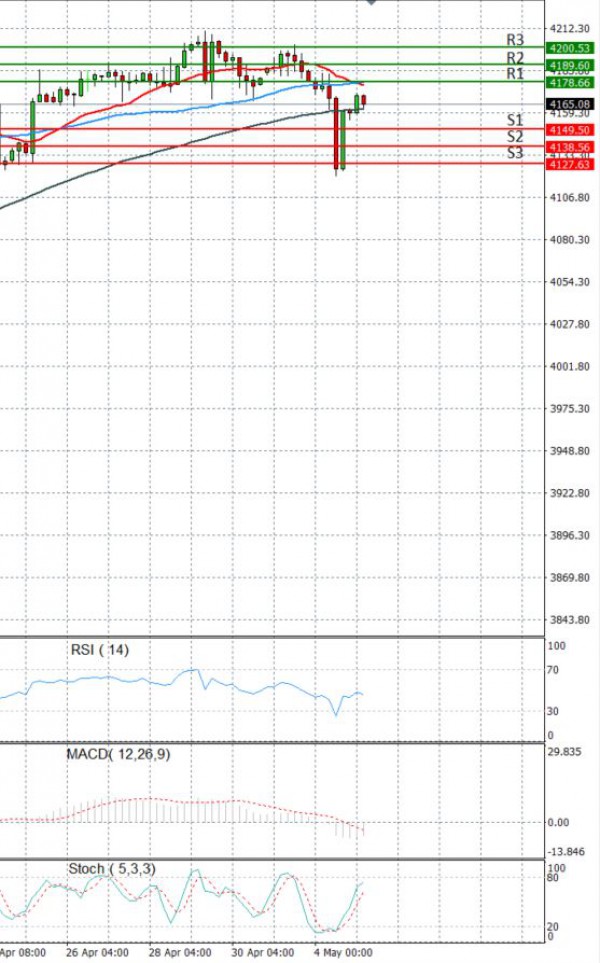
EU Session Analysis for CFD Instruments 05/05/2021
Fundamental analysis
05 May, 2021
The USA500 fell and the Nasdaq ended sharply lower on Tuesday as investors dumped megacap growth stocks to seek shelter in more defensive parts of the market, amid concerns on rising interest rates and uncertainty over an upcoming jobs report. Highly valued technology-related companies including Microsoft Corp, Alphabet, Apple, Amazon.com and Facebook sold off across the board. Comments by Treasury Secretary Janet Yellen on the potential need for interest rate hikes further exacerbated the tech selloff, as investors worry higher rates would weigh on valuations of growth companies. "It may be that interest rates will have to rise somewhat to make sure that our economy doesn't overheat, even though the additional spending is relatively small relative to the size of the economy," she said in taped comments at a virtual event by The Atlantic.