Fortrade Canada Ltd. as an order-execution only dealer is not permitted to provide you with any advice or recommendations. These Market Commentaries should not be construed as a recommendation, advice or any attempt by Fortrade Canada Ltd. to prompt or influence you in making an investment decision to purchase, sell, hold or exchange any security or to influence the timing of such activity. This content is produced by Fortrade Limited which is not registered in any capacity with any securities regulatory authority in Canada.
71% of retail investor accounts lose money when trading CFDs with this provider.
CFDs are complex instruments and come with a high risk of losing money rapidly due to leverage. 71% of retail investor accounts lose money when trading CFDs with this provider. You should consider whether you understand how CFDs work and whether you can afford to take the high risk of losing your money.
70.91% of retail investor accounts lose money when trading CFDs with this provider.
CFDs are complex instruments and come with a high risk of losing money rapidly due to leverage. 70.91% of retail investor accounts lose money when trading CFDs with this provider. You should consider whether you understand how CFDs work and whether you can afford to take the high risk of losing all your money. Read full risk warning.
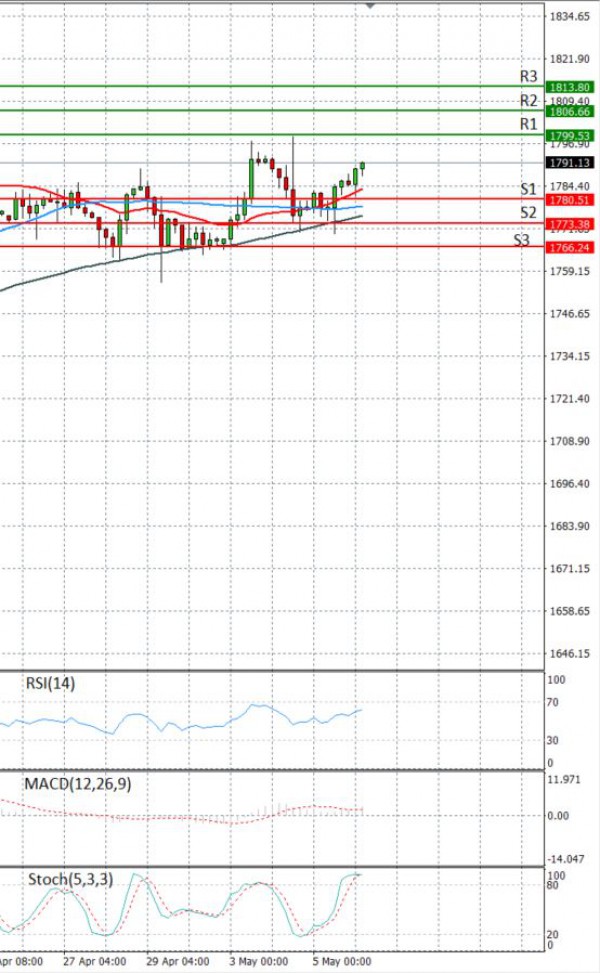
EU Session Analysis for CFD Instruments 06/05/2021
Fundamental analysis
06 May, 2021
Gold prices edged higher on Thursday as a dip in U.S. treasury yields offset pressure from a stronger dollar, while investors awaited U.S. non-farm payrolls data for April due later this week. Benchmark U.S. 10-year Treasury yields hovered close to a one-week low hit on Tuesday, reducing the opportunity cost of holding non-interest bearing gold. The dollar index, meanwhile, rose 0.1% against its rivals, hovering close to a two-week high hit on Wednesday. Focus now shifts to Friday’s U.S. monthly jobs report, which is expected to show non-farm-payrolls increased by 978,000 last month. Lower interest rates decrease the opportunity cost of holding non-yielding bullion.