Fortrade Canada Ltd. as an order-execution only dealer is not permitted to provide you with any advice or recommendations. These Market Commentaries should not be construed as a recommendation, advice or any attempt by Fortrade Canada Ltd. to prompt or influence you in making an investment decision to purchase, sell, hold or exchange any security or to influence the timing of such activity. This content is produced by Fortrade Limited which is not registered in any capacity with any securities regulatory authority in Canada.
71% of retail investor accounts lose money when trading CFDs with this provider.
CFDs are complex instruments and come with a high risk of losing money rapidly due to leverage. 71% of retail investor accounts lose money when trading CFDs with this provider. You should consider whether you understand how CFDs work and whether you can afford to take the high risk of losing your money.
70.91% of retail investor accounts lose money when trading CFDs with this provider.
CFDs are complex instruments and come with a high risk of losing money rapidly due to leverage. 70.91% of retail investor accounts lose money when trading CFDs with this provider. You should consider whether you understand how CFDs work and whether you can afford to take the high risk of losing all your money. Read full risk warning.
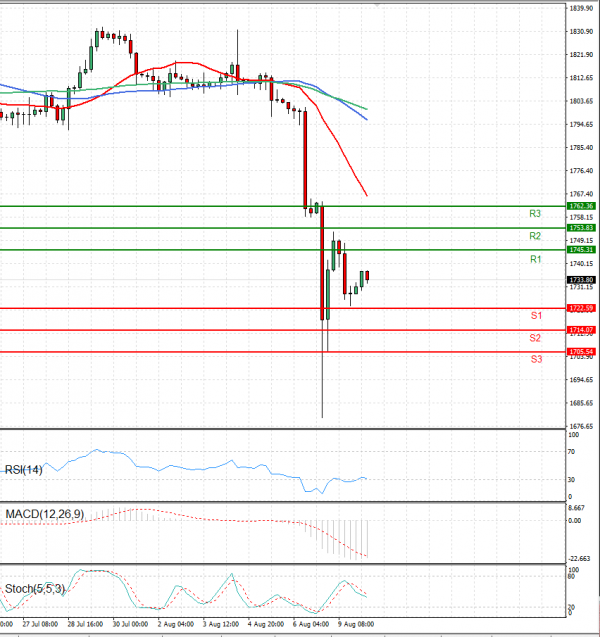
EU Session Analysis for CFD Instruments 10/08/2021
Fundamental analysis
10 August, 2021
Gold prices edged higher on Tuesday, after touching a four-month low in the previous session, as the dollar paused its rally, spurring demand for the safe-haven metal. A stronger dollar makes gold more expensive to holders of other currencies. The dollar index held steady against its rivals after solid gains in the last two sessions. Two Federal Reserve officials said the U.S. economy is growing rapidly and while the labour market still has room for improvement, inflation is already at a level that could satisfy one leg of a key test for the beginning of interest rate hikes. Though gold is viewed as a hedge against higher inflation, a Fed rate hike would dull its appeal as it increases the opportunity cost of holding the non-yielding metal.