Fortrade Canada Ltd. as an order-execution only dealer is not permitted to provide you with any advice or recommendations. These Market Commentaries should not be construed as a recommendation, advice or any attempt by Fortrade Canada Ltd. to prompt or influence you in making an investment decision to purchase, sell, hold or exchange any security or to influence the timing of such activity. This content is produced by Fortrade Limited which is not registered in any capacity with any securities regulatory authority in Canada.
69% of retail investor accounts lose money when trading CFDs with this provider.
CFDs are complex instruments and come with a high risk of losing money rapidly due to leverage. 69% of retail investor accounts lose money when trading CFDs with this provider. You should consider whether you understand how CFDs work and whether you can afford to take the high risk of losing your money.
67.52% of retail investor accounts lose money when trading CFDs with this provider.
CFDs are complex instruments and come with a high risk of losing money rapidly due to leverage. 67.52% of retail investor accounts lose money when trading CFDs with this provider. You should consider whether you understand how CFDs work and whether you can afford to take the high risk of losing all your money. Read full risk warning.
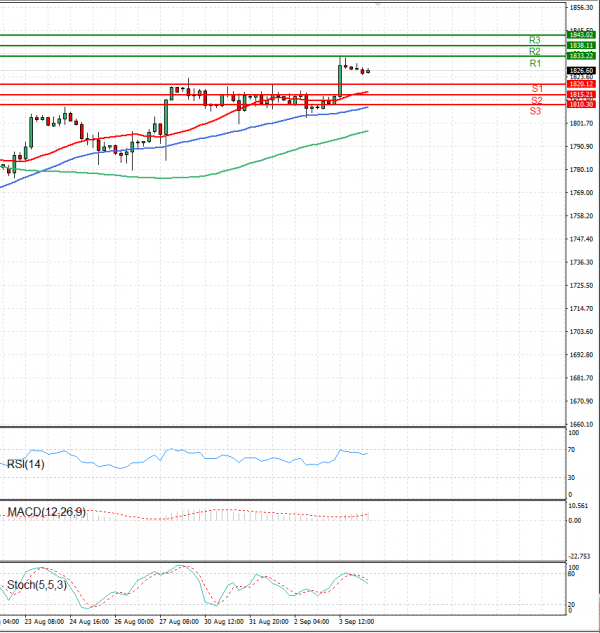
EU Session Analysis for CFD Instruments 06/09/2021
Fundamental analysis
06 September, 2021
During Asian trading, the price of gold has strengthened its gains from Friday. NFP data showed a much worse state of the US labor market (than expected) in August, which was a signal that the US Federal Reserve will continue its ultra-light monetary policy in the future. First of all, the Fed will refrain from gradually reducing the program of buying bonds from the open market, an amount of 120 billion dollars a month. That scenario supports the price of gold. At around 08:30, the price of gold is trading at 1828 dollars per fine ounce, which represents a price increase of 0,02%.