Fortrade Canada Ltd. as an order-execution only dealer is not permitted to provide you with any advice or recommendations. These Market Commentaries should not be construed as a recommendation, advice or any attempt by Fortrade Canada Ltd. to prompt or influence you in making an investment decision to purchase, sell, hold or exchange any security or to influence the timing of such activity. This content is produced by Fortrade Limited which is not registered in any capacity with any securities regulatory authority in Canada.
71% of retail investor accounts lose money when trading CFDs with this provider.
CFDs are complex instruments and come with a high risk of losing money rapidly due to leverage. 71% of retail investor accounts lose money when trading CFDs with this provider. You should consider whether you understand how CFDs work and whether you can afford to take the high risk of losing your money.
70.41% of retail investor accounts lose money when trading CFDs with this provider.
CFDs are complex instruments and come with a high risk of losing money rapidly due to leverage. 70.41% of retail investor accounts lose money when trading CFDs with this provider. You should consider whether you understand how CFDs work and whether you can afford to take the high risk of losing all your money. Read full risk warning.
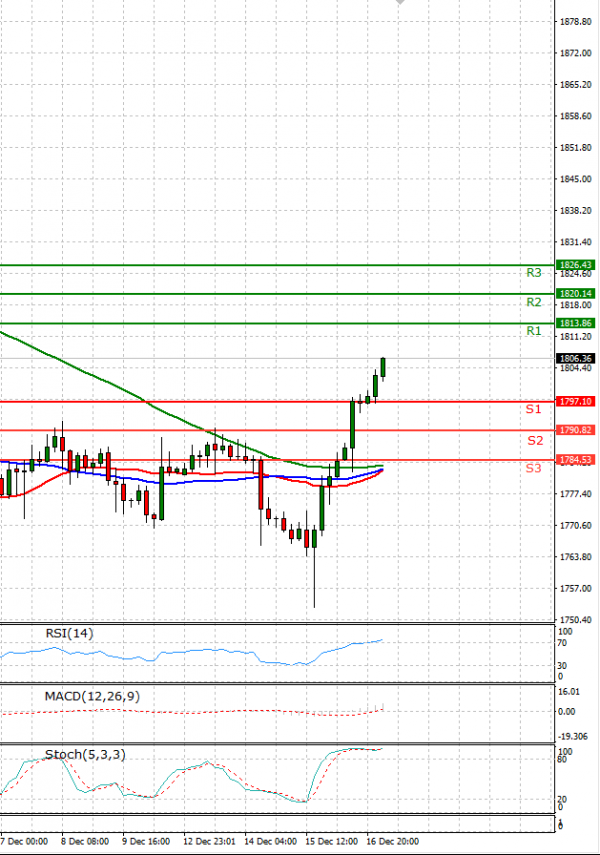
EU Session Analysis for CFD Instruments 20/12/2021
Fundamental analysis
20 December, 2021
Gold prices edged higher on Monday, hovering near a three-week high hit last week, as fears over the rapidly spreading Omicron coronavirus variant boosted the metal's safe-haven appeal. U.S. Federal Reserve officials talked about raising rates as soon as March and starting to run down the central bank's balance sheet in mid-2022. However, the remarks barely changed the bond market's view that short-term interest rates could top out below the Fed's estimated peak. Meanwhile, the U.S. dollar index hovered close to a three-week high hit in the previous week, limiting gains in bullion as a firmer greenback makes the metal more expensive for holders of other currencies.