Fortrade Canada Ltd. as an order-execution only dealer is not permitted to provide you with any advice or recommendations. These Market Commentaries should not be construed as a recommendation, advice or any attempt by Fortrade Canada Ltd. to prompt or influence you in making an investment decision to purchase, sell, hold or exchange any security or to influence the timing of such activity. This content is produced by Fortrade Limited which is not registered in any capacity with any securities regulatory authority in Canada.
71% of retail investor accounts lose money when trading CFDs with this provider.
CFDs are complex instruments and come with a high risk of losing money rapidly due to leverage. 71% of retail investor accounts lose money when trading CFDs with this provider. You should consider whether you understand how CFDs work and whether you can afford to take the high risk of losing your money.
70.91% of retail investor accounts lose money when trading CFDs with this provider.
CFDs are complex instruments and come with a high risk of losing money rapidly due to leverage. 70.91% of retail investor accounts lose money when trading CFDs with this provider. You should consider whether you understand how CFDs work and whether you can afford to take the high risk of losing all your money. Read full risk warning.
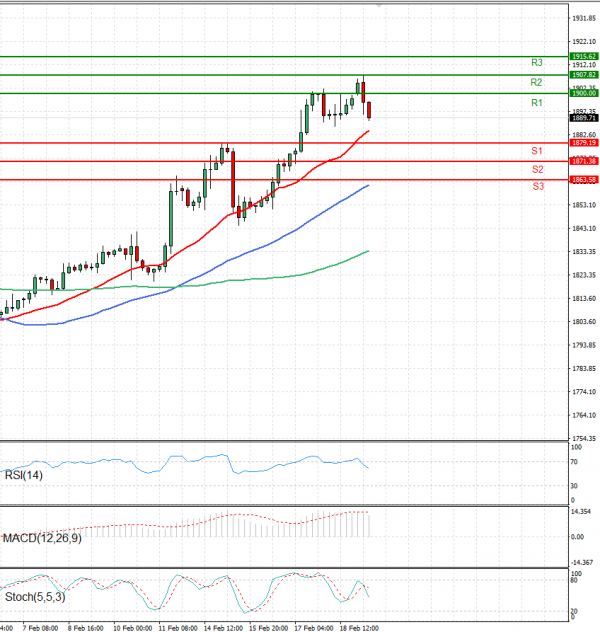
EU Session Analysis for CFD Instruments 21/02/2022
Fundamental analysis
21 February, 2022
Gold prices fell from a more than eight-month high hit earlier on Monday, as safe-haven demand eased after the U.S. president agreed to meet his Russian counterpart over the Ukraine crisis. U.S. President Joe Biden has accepted in principle a summit with Russia's Vladimir Putin over the Ukraine crisis after the two countries' foreign ministers meet next week and if an invasion has not occurred, the White House said on Sunday. Russia will extend military drills in Belarus that were due to end on Sunday, the Belarusian defence ministry announced, adding to mounting tensions as satellite images appeared to show new deployments of Russian armour and troops close to Ukraine.