Fortrade Canada Ltd. as an order-execution only dealer is not permitted to provide you with any advice or recommendations. These Market Commentaries should not be construed as a recommendation, advice or any attempt by Fortrade Canada Ltd. to prompt or influence you in making an investment decision to purchase, sell, hold or exchange any security or to influence the timing of such activity. This content is produced by Fortrade Limited which is not registered in any capacity with any securities regulatory authority in Canada.
71% of retail investor accounts lose money when trading CFDs with this provider.
CFDs are complex instruments and come with a high risk of losing money rapidly due to leverage. 71% of retail investor accounts lose money when trading CFDs with this provider. You should consider whether you understand how CFDs work and whether you can afford to take the high risk of losing your money.
70.91% of retail investor accounts lose money when trading CFDs with this provider.
CFDs are complex instruments and come with a high risk of losing money rapidly due to leverage. 70.91% of retail investor accounts lose money when trading CFDs with this provider. You should consider whether you understand how CFDs work and whether you can afford to take the high risk of losing all your money. Read full risk warning.
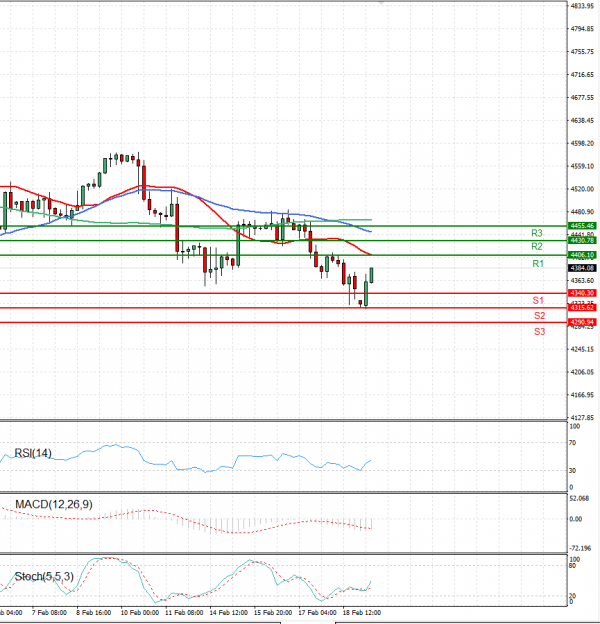
EU Session Analysis for CFD Instruments 21/02/2022
Fundamental analysis
21 February, 2022
Wall Street's main stock indexes fell on Friday as escalating tensions in Ukraine and U.S. statements of an imminent Russian invasion prompted investors to dump risky assets in the run-up to a long weekend.Russian news agencies reported a blast occurred in the eastern Ukraine city of Donetsk and that separatists planned to evacuate residents from the region to Russia due to heavy shelling. Western countries said that Russia was continuing military build-up around Ukraine, adding the country may use the current developments to justify an incursion into Ukraine. Speculations about the Federal Reserve's next move have also weighed on equities. New York Fed Bank President John Williams said earlier in the day it would be appropriate to hike interest rates in March, without mentioning the magnitude.