Fortrade Canada Ltd. as an order-execution only dealer is not permitted to provide you with any advice or recommendations. These Market Commentaries should not be construed as a recommendation, advice or any attempt by Fortrade Canada Ltd. to prompt or influence you in making an investment decision to purchase, sell, hold or exchange any security or to influence the timing of such activity. This content is produced by Fortrade Limited which is not registered in any capacity with any securities regulatory authority in Canada.
71% of retail investor accounts lose money when trading CFDs with this provider.
CFDs are complex instruments and come with a high risk of losing money rapidly due to leverage. 71% of retail investor accounts lose money when trading CFDs with this provider. You should consider whether you understand how CFDs work and whether you can afford to take the high risk of losing your money.
70.41% of retail investor accounts lose money when trading CFDs with this provider.
CFDs are complex instruments and come with a high risk of losing money rapidly due to leverage. 70.41% of retail investor accounts lose money when trading CFDs with this provider. You should consider whether you understand how CFDs work and whether you can afford to take the high risk of losing all your money. Read full risk warning.
EU Session Analysis for CFD Instruments 24/08/2023
Fundamental analysis
24 August, 2023
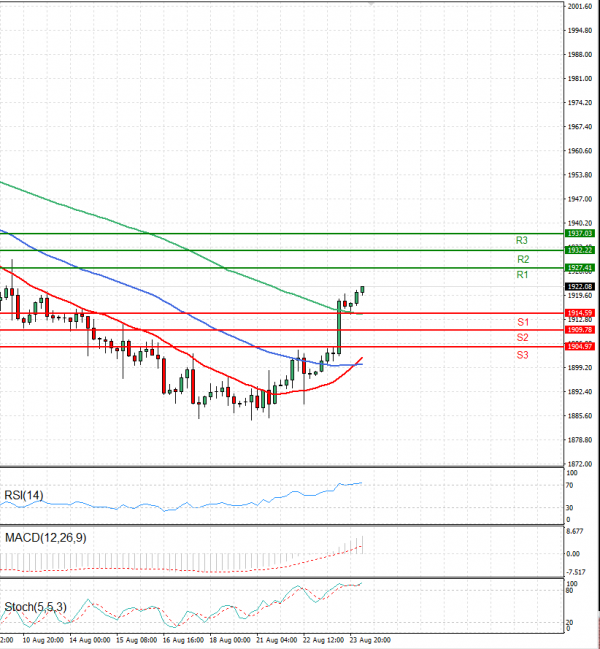
Gold price ended yesterday above 1913.15 level, to confirm opening the way to continue the bullish wave and achieve new positive targets that start at 1929.00 and extend to 1945.20. The gold price has been trending upwards for the fourth day in a row and is currently trading at the nearly two-week high of 1,920 reached in the previous session. A series of manufacturing surveys released Wednesday highlighted a bleak picture of the health of the global economy amid worsening economic conditions in China. Moreover, disappointing US macroeconomic data suggested business activity in the world's largest economy was largely stagnant in August. These developments have fuelled fears that the global economic downturn could become even more severe, making gold's price attractive as a safe-haven asset.