CFDs are complex instruments and come with a high risk of losing money rapidly due to leverage. 77% of retail investor accounts lose money when trading CFDs with this provider. You should consider whether you understand how CFDs work and whether you can afford to take the high risk of losing your money.
CFDs are complex instruments and come with a high risk of losing money rapidly due to leverage. 76% of retail investor accounts lose money when trading CFDs with this provider. You should consider whether you can afford to take the high risk of losing your money.

Gold - Usd Dollar Analysis

EU Session Analysis for CFD Instruments 28/03/2024

Fundamental analysis

28 March, 2024

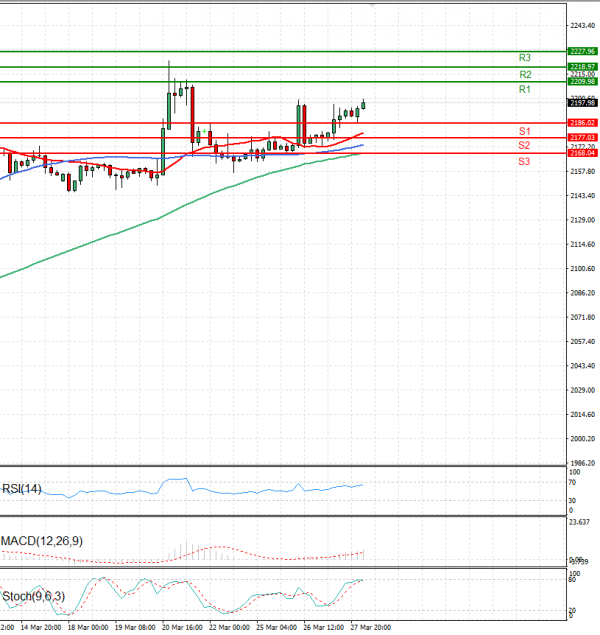
Gold prices are trading higher in today’s Asian session above 2190 levels.

Worldwide, gold prices stabilised on Thursday as investors absorbed remarks from Federal Reserve Governor Christopher Waller regarding interest rate adjustments and awaited additional U.S. economic data for insights into policy direction.

According to commodity market analysts, gold prices have pulled back from recent peaks due to profit-taking. However, the precious metal still retains momentum and could potentially reach new record highs soon, fueled by expectations of further rate cuts by the US Federal Reserve.

Rate cuts typically imply looser monetary policy, leading to potential inflationary pressures, and gold is commonly viewed as a hedge against inflation.

Technical analysis

Gold - Usd Dollar Analysis Technical analysis 28/03/2024
Time Frame: 1 hour

GOLD Support & Resistance Table - 28/03/2024

Support & Resistance Level Explanation
Resistance 2 2218.97 Daily R2
Resistance 1 2209.98 Daily R1
Support 1 2186.02 Daily S1
Support 2 2177.03 Daily S2

GOLD Indicator Table - 28/03/2024

Indicator Signal
SMA 20 Buy
SMA 50 Buy
SMA 100 Buy
MACD( 12;26;9) Buy
RSI (14) Buy
Stochastic ( 9;6;3) Buy

GOLD Indicator / Period Table - 28/03/2024

Indicator / Period Day - BuyWeek - BuyMonth - Buy
MACD( 12;26;9) Buy BuyBuy
RSI (14) Buy BuyBuy
SMA 20 Buy BuyBuy

GOLD 28/03/2024 - Reference Price : 2197.98

Buy
Simple Moving AverageBuy (3)Sell (0)
Technical Indicators - OscillatorsBuy (3)Sell (0)
Share It With Your Network
GOLD Chart
Update Time: -
Highest
Lowest
1M 5M H D W
Prices are loading..
Ready for trading?Start Now