CFDs are complex instruments and come with a high risk of losing money rapidly due to leverage. 77% of retail investor accounts lose money when trading CFDs with this provider. You should consider whether you understand how CFDs work and whether you can afford to take the high risk of losing your money.
CFDs are complex instruments and come with a high risk of losing money rapidly due to leverage. 76% of retail investor accounts lose money when trading CFDs with this provider. You should consider whether you can afford to take the high risk of losing your money.

USA500 Analysis

EU Session Analysis for CFD Instruments 28/03/2024

Fundamental analysis

28 March, 2024

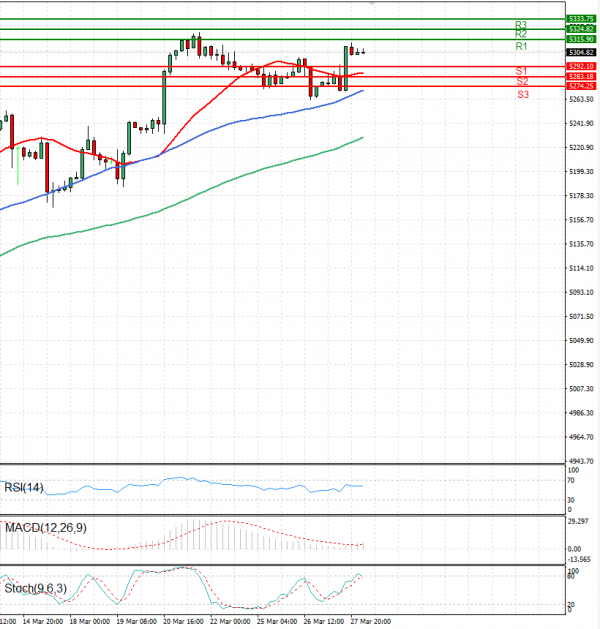
The USA500 is currently trading above 5,200 levels.

Overnight, U.S. stock futures hovered near the flatline as the S&P 500 approached its strongest first-quarter performance in five years.

Investors in the U.S. are eagerly awaiting key data releases on jobless claims, gross domestic product (GDP), and consumer sentiment scheduled for Thursday.

Despite the anticipation surrounding these economic indicators and Federal Reserve communications, trading volumes remained subdued as investors prepared for the upcoming Good Friday holiday.

S&P 500 Futures dipped 0.1%, Nasdaq 100 Futures also declined 0.1% and Dow Jones Futures edged down 0.1%. The cautious sentiment in evening trading reflects investors' watchfulness amidst evolving economic data and central bank announcements.

Technical analysis

USA500 Analysis Technical analysis 28/03/2024
Time Frame: 1 hour

USA500 Support & Resistance Table - 28/03/2024

Support & Resistance Level Explanation
Resistance 2 5324.82 Daily R2
Resistance 1 5315.90 Daily R1
Support 1 5292.10 Daily S1
Support 2 5283.18 Daily S2

USA500 Indicator Table - 28/03/2024

Indicator Signal
SMA 20 Buy
SMA 50 Buy
SMA 100 Buy
MACD( 12;26;9) Buy
RSI (14) Neutral
Stochastic ( 9;6;3) Sell

USA500 Indicator / Period Table - 28/03/2024

Indicator / Period Day - BuyWeek - BuyMonth - Buy
MACD( 12;26;9) Buy BuyBuy
RSI (14) Neutral BuyBuy
SMA 20 Buy BuyBuy

USA500 28/03/2024 - Reference Price : 5304.82

Buy
Simple Moving AverageBuy (3)Sell (0)
Technical Indicators - OscillatorsBuy (1)Sell (1)
Share It With Your Network
USA500 Chart
Update Time: -
Highest
Lowest
1M 5M H D W
Prices are loading..
Ready for trading?Start Now