CFDs are complex instruments and come with a high risk of losing money rapidly due to leverage. 77% of retail investor accounts lose money when trading CFDs with this provider. You should consider whether you understand how CFDs work and whether you can afford to take the high risk of losing your money.
CFDs are complex instruments and come with a high risk of losing money rapidly due to leverage. 76% of retail investor accounts lose money when trading CFDs with this provider. You should consider whether you can afford to take the high risk of losing your money.

Gold - Usd Dollar Analysis

EU Session Analysis for CFD Instruments 17/04/2024

Fundamental analysis

17 April, 2024

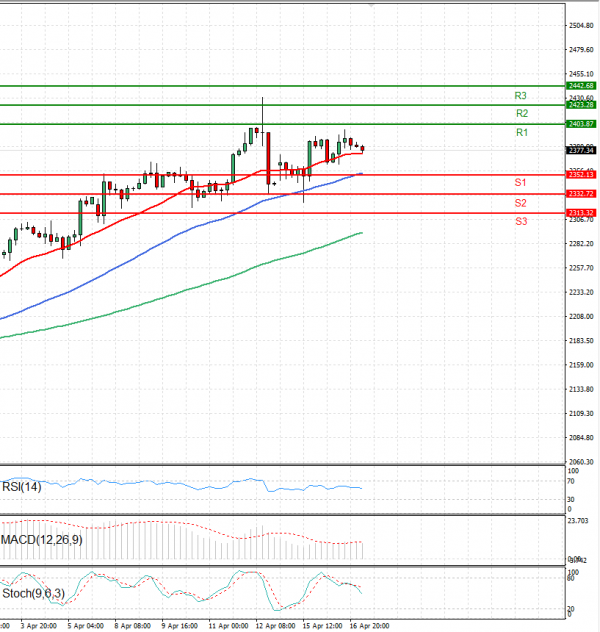
Gold prices are trading in today’s Asian session above 2370 levels.

Gold prices experienced a marginal decline during Asian trading on Wednesday, influenced by Jerome Powell's hawkish-leaning remarks that bolstered the dollar and Treasury yields, thus exerting downward pressure on the value of gold.

Despite this, gold prices retained proximity to recent highs, fueled by ongoing apprehensions regarding potential conflict between Iran and Israel, sustaining demand for safe-haven assets.

Last week, gold prices surged to unprecedented levels following an Iranian strike against Israel. Market attention now centres on Jerusalem's anticipated response, with reports suggesting imminent action.

Technical analysis

Gold - Usd Dollar Analysis Technical analysis 17/04/2024
Time Frame: 1 hour

GOLD Support & Resistance Table - 17/04/2024

Support & Resistance Level Explanation
Resistance 2 2423.28 Daily R2
Resistance 1 2403.87 Daily R1
Support 1 2352.13 Daily S1
Support 2 2332.72 Daily S2

GOLD Indicator Table - 17/04/2024

Indicator Signal
SMA 20 Buy
SMA 50 Buy
SMA 100 Buy
MACD( 12;26;9) Buy
RSI (14) Sell
Stochastic ( 9;6;3) Sell

GOLD Indicator / Period Table - 17/04/2024

Indicator / Period Day - BuyWeek - BuyMonth - Buy
MACD( 12;26;9) Buy BuyBuy
RSI (14) Sell BuyBuy
SMA 20 Buy BuyBuy

GOLD 17/04/2024 - Reference Price : 2377.34

Buy
Simple Moving AverageBuy (3)Sell (0)
Technical Indicators - OscillatorsBuy (1)Sell (2)
Share It With Your Network
GOLD Chart
Update Time: -
Highest
Lowest
1M 5M H D W
Prices are loading..
Ready for trading?Start Now