CFDs are complex instruments and come with a high risk of losing money rapidly due to leverage. 77% of retail investor accounts lose money when trading CFDs with this provider. You should consider whether you understand how CFDs work and whether you can afford to take the high risk of losing your money.
CFDs are complex instruments and come with a high risk of losing money rapidly due to leverage. 76% of retail investor accounts lose money when trading CFDs with this provider. You should consider whether you can afford to take the high risk of losing your money.

USA500 Analysis

EU Session Analysis for CFD Instruments 17/04/2024

Fundamental analysis

17 April, 2024

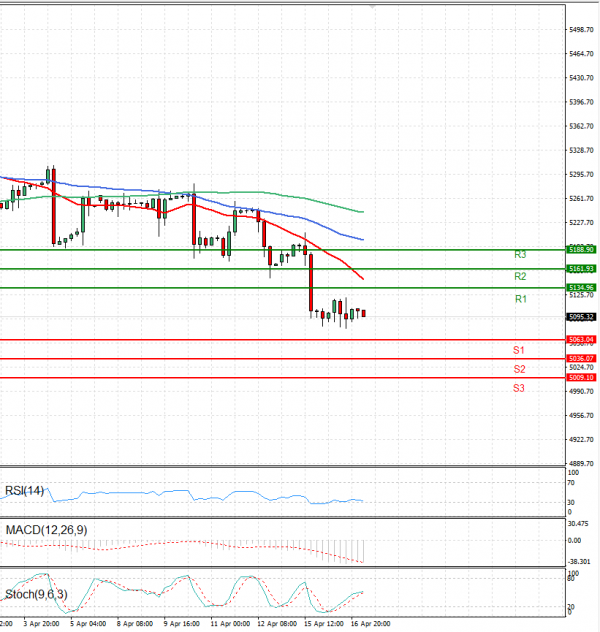
The USA500 is currently trading above 5,000 levels.

In late trading on Tuesday, U.S. stock index futures edged up slightly, indicating a potential stabilisation on Wall Street following concerns about prolonged higher interest rates that led to significant losses.

However, investor sentiment remained delicate, particularly amidst ongoing geopolitical tensions in the Middle East. Additionally, key Federal Reserve officials reiterated the central bank's stance on maintaining steady interest rates.

S&P 500 Futures increased by 0.2%, while Nasdaq 100 Futures and Dow Jones Futures both advanced by 0.2%.

Technical analysis

USA500 Analysis Technical analysis 17/04/2024
Time Frame: 1 hour

USA500 Support & Resistance Table - 17/04/2024

Support & Resistance Level Explanation
Resistance 2 5161.93 Daily R2
Resistance 1 5134.96 Daily R1
Support 1 5063.04 Daily S1
Support 2 5036.07 Daily S2

USA500 Indicator Table - 17/04/2024

Indicator Signal
SMA 20 Sell
SMA 50 Sell
SMA 100 Sell
MACD( 12;26;9) Sell
RSI (14) Sell
Stochastic ( 9;6;3) Buy

USA500 Indicator / Period Table - 17/04/2024

Indicator / Period Day - SellWeek - BuyMonth - Buy
MACD( 12;26;9) Sell BuyBuy
RSI (14) Sell BuyBuy
SMA 20 Sell BuyBuy

USA500 17/04/2024 - Reference Price : 5095.32

Sell
Simple Moving AverageBuy (0)Sell (3)
Technical Indicators - OscillatorsBuy (1)Sell (2)
Share It With Your Network
USA500 Chart
Update Time: -
Highest
Lowest
1M 5M H D W
Prices are loading..
Ready for trading?Start Now