CFDs are complex instruments and come with a high risk of losing money rapidly due to leverage. 69% of retail investor accounts lose money when trading CFDs with this provider. You should consider whether you understand how CFDs work and whether you can afford to take the high risk of losing your money.
CFDs are complex instruments and come with a high risk of losing money rapidly due to leverage. 70.88% of retail investor accounts lose money when trading CFDs with this provider. You should consider whether you understand how CFDs work and whether you can afford to take the high risk of losing all your money. Read full risk warning.

Gold - Usd Dollar Analysis

EU Session Analysis for CFD Instruments 18/02/2026

Fundamental analysis

18 February, 2026

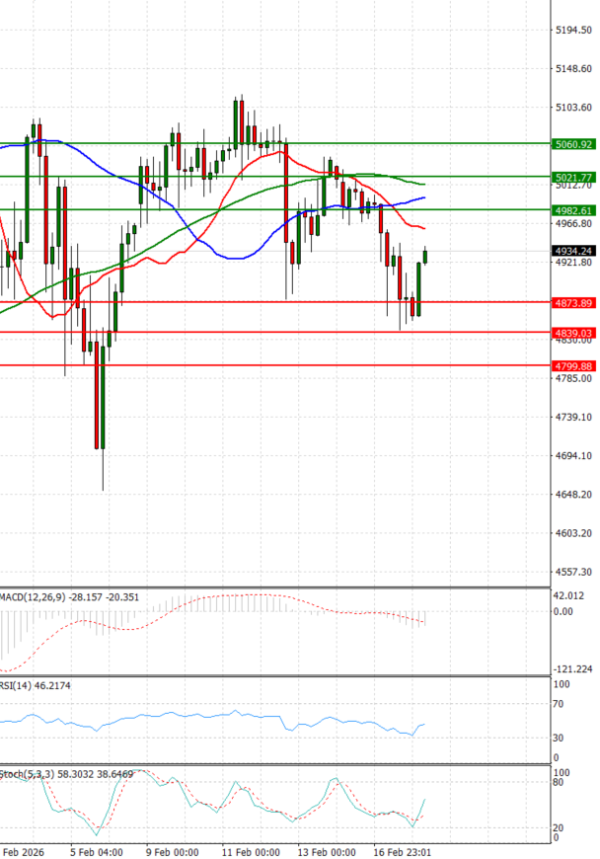
Gold prices are trading in today’s Asian session above $4,920 levels.

Gold rose to around $4,920 per ounce on Wednesday, recouping some losses from a two-day decline, as investors are now watching further Fed remarks, FOMC minutes, and key GDP and PCE data due later this week for more guidance.

Technical analysis

Gold - Usd Dollar Analysis Technical analysis 18/02/2026
Time Frame: 1 hour

GOLD Support & Resistance Table - 18/02/2026

Support & Resistance Level Explanation
Resistance 2 5021.77 Daily R2
Resistance 1 4982.61 Daily R1
Support 1 4878.19 Daily S1
Support 2 4839.03 Daily S2

GOLD Indicator Table - 18/02/2026

Indicator Signal
SMA 20 Sell
SMA 50 Sell
SMA 100 Sell
MACD( 12;26;9) Sell
RSI (14) Sell
Stochastic ( 9;6;3) Sell

GOLD Indicator / Period Table - 18/02/2026

Indicator / Period Day - SellWeek - BuyMonth - Buy
MACD( 12;26;9) Sell BuyBuy
RSI (14) Sell BuyBuy
SMA 20 Sell SellBuy

GOLD 18/02/2026 - Reference Price : 4930.40

Sell
Simple Moving AverageBuy (0)Sell (3)
Technical Indicators - OscillatorsBuy (0)Sell (3)
Share It With Your Network
GOLD Chart
Update Time: -
Highest
Lowest
1M 5M H D W
Prices are loading..
Ready for trading?Start Now