CFDs are complex instruments and come with a high risk of losing money rapidly due to leverage. 69% of retail investor accounts lose money when trading CFDs with this provider. You should consider whether you understand how CFDs work and whether you can afford to take the high risk of losing your money.
CFDs are complex instruments and come with a high risk of losing money rapidly due to leverage. 70.88% of retail investor accounts lose money when trading CFDs with this provider. You should consider whether you understand how CFDs work and whether you can afford to take the high risk of losing all your money. Read full risk warning.

USA500 Analysis

EU Session Analysis for CFD Instruments 18/02/2026

Fundamental analysis

18 February, 2026

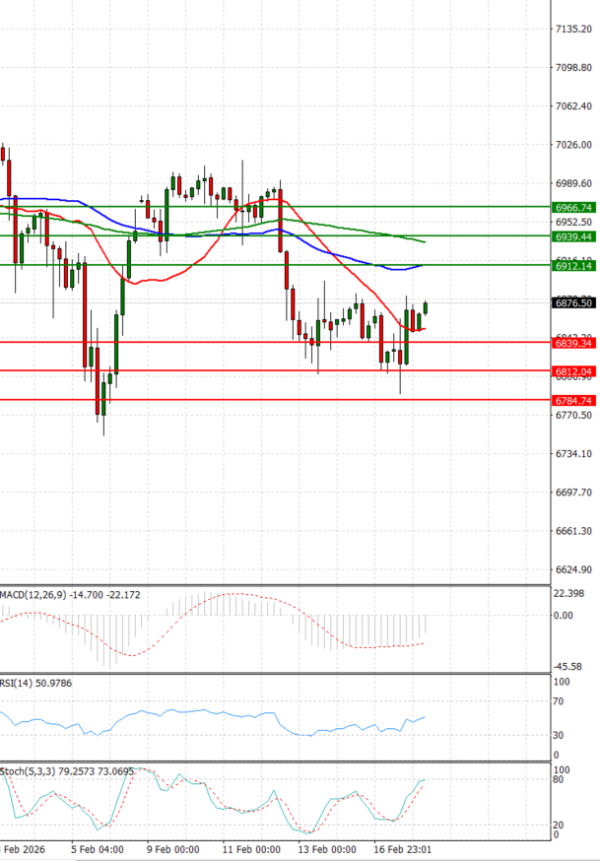
The USA500 is currently trading above 6,870 levels.

US equity rose slightly on Tuesday as investors awaited minutes from the Fed’s last policy meeting for clearer guidance on the trajectory of interest rates. Markets are also focused on Friday’s release of the PCE Price Index, the Fed’s preferred measure of inflation.

On Tuesday the S&P 500 advanced 0.10%, the Dow Jones increased 0.07% and the Nasdaq rose 0.14%.

Technical analysis

USA500 Analysis Technical analysis 18/02/2026
Time Frame: 1 hour

USA500 Support & Resistance Table - 18/02/2026

Support & Resistance Level Explanation
Resistance 2 6939.44 Daily R2
Resistance 1 6912.14 Daily R1
Support 1 6839.34 Daily S1
Support 2 6812.04 Daily S2

USA500 Indicator Table - 18/02/2026

Indicator Signal
SMA 20 Buy
SMA 50 Sell
SMA 100 Sell
MACD( 12;26;9) Sell
RSI (14) Buy
Stochastic ( 9;6;3) Buy

USA500 Indicator / Period Table - 18/02/2026

Indicator / Period Day - BuyWeek - SellMonth - Buy
MACD( 12;26;9) Sell SellBuy
RSI (14) Buy SellBuy
SMA 20 Buy SellNeutral

USA500 18/02/2026 - Reference Price : 6875.74

Buy
Simple Moving AverageBuy (1)Sell (2)
Technical Indicators - OscillatorsBuy (2)Sell (1)
Share It With Your Network
USA500 Chart
Update Time: -
Highest
Lowest
1M 5M H D W
Prices are loading..
Ready for trading?Start Now