CFDs are complex instruments and come with a high risk of losing money rapidly due to leverage. 77% of retail investor accounts lose money when trading CFDs with this provider. You should consider whether you understand how CFDs work and whether you can afford to take the high risk of losing your money.
CFDs are complex instruments and come with a high risk of losing money rapidly due to leverage. 76% of retail investor accounts lose money when trading CFDs with this provider. You should consider whether you can afford to take the high risk of losing your money.

USA500 Analysis

EU Session Analysis for CFD Instruments 23/02/2021

Fundamental analysis

23 February, 2021

The S&P 500 and Nasdaq closed lower on Monday as climbing Treasury yields and prospects of rising inflation triggered valuation concerns, hitting shares of high-flying growth companies. U.S. benchmark 10-year Treasury yields were up at 1.37% on Monday. Since the beginning of February, 10-year yields have risen about 26 basis points, on track for their largest monthly gain in three years. Still, some analysts noted that the stocks pullback was expected after a torrid rally this year and in 2020. Shares of Apple Inc, Microsoft Corp, Alphabet Inc, Tesla Inc and Amazon.com Inc resumed their slide from the previous week. Value stocks have outperformed growth shares in February, with investors betting on a rebound in industrial activity and a pickup in consumer demand as countries roll out vaccines to tame the pandemic. Fears of higher long term yields are starting to give the equity markets jitters.
Technical analysis

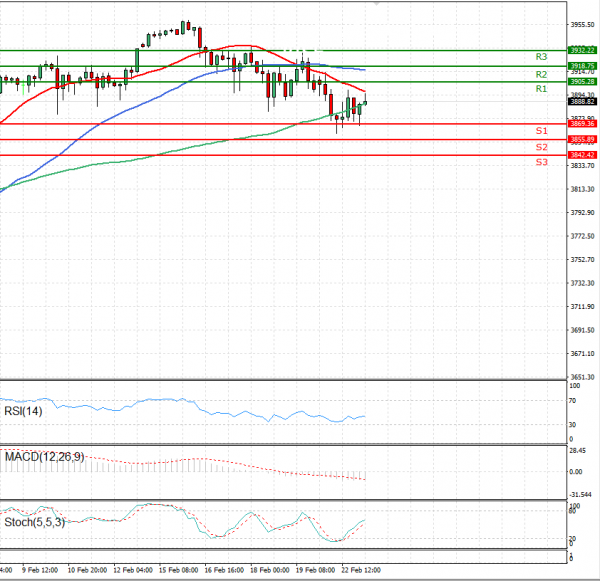
USA500 Analysis Technical analysis 23/02/2021
Time Frame: 1 hour

USA500 Support & Resistance Table - 23/02/2021

Support & Resistance Level Explanation
Resistance 2 3918.75 Daily R2
Resistance 1 3905.28 Daily R1
Support 1 3869.36 Daily S1
Support 2 3855.89 Daily S2

USA500 Indicator Table - 23/02/2021

Indicator Signal
SMA 20 Sell
SMA 50 Sell
SMA 100 Sell
MACD( 12;26;9) Sell
RSI (14) Buy
Stochastic ( 9;6;3) Buy

USA500 Indicator / Period Table - 23/02/2021

Indicator / Period Day - SellWeek - BuyMonth - Buy
MACD( 12;26;9) Sell BuyBuy
RSI (14) Buy BuyBuy
SMA 20 Sell BuyBuy

USA500 23/02/2021 - Reference Price : 3888.82

Sell
Simple Moving AverageBuy (0)Sell (3)
Technical Indicators - OscillatorsBuy (2)Sell (1)
Share It With Your Network
USA500 Chart
Update Time: -
Highest
Lowest
1M 5M H D W
Prices are loading..
Ready for trading?Start Now