Fortrade Canada Ltd. as an order-execution only dealer is not permitted to provide you with any advice or recommendations. These Market Commentaries should not be construed as a recommendation, advice or any attempt by Fortrade Canada Ltd. to prompt or influence you in making an investment decision to purchase, sell, hold or exchange any security or to influence the timing of such activity. This content is produced by Fortrade Limited which is not registered in any capacity with any securities regulatory authority in Canada.
69% of retail investor accounts lose money when trading CFDs with this provider.
CFDs are complex instruments and come with a high risk of losing money rapidly due to leverage. 69% of retail investor accounts lose money when trading CFDs with this provider. You should consider whether you understand how CFDs work and whether you can afford to take the high risk of losing your money.
70.88% of retail investor accounts lose money when trading CFDs with this provider.
CFDs are complex instruments and come with a high risk of losing money rapidly due to leverage. 70.88% of retail investor accounts lose money when trading CFDs with this provider. You should consider whether you understand how CFDs work and whether you can afford to take the high risk of losing all your money. Read full risk warning.
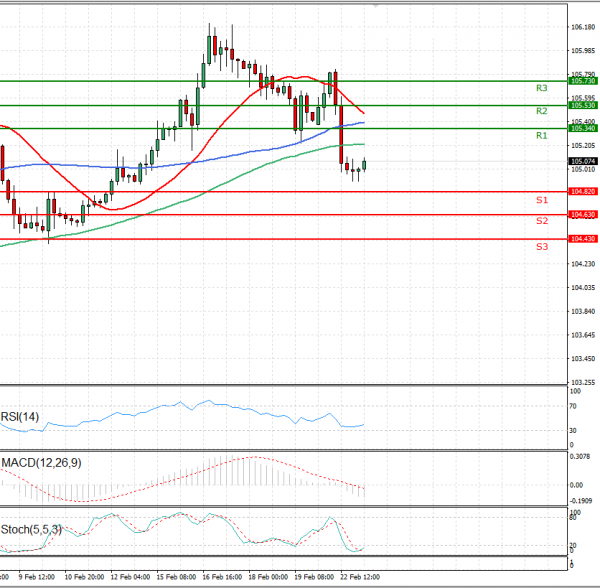
EU Session Analysis for CFD Instruments 23/02/2021
Fundamental analysis
23 February, 2021
The USD/JPY pair inched lower to 105.03 on Tuesday. The pair fell sharply on Monday as the Greenback weakened. Japan’s Corporate Services Price Index (CSPI) fell 0.5%, Year-over-Year. In the United States, the Dallas Fed Manufacturing Business index for February printed at 17.2. That was an improvement over January’s figure of 7.0. The U.S. Leading Index for January was reported to be 0.5%, Month-over-Month, as expected.