Fortrade Canada Ltd. as an order-execution only dealer is not permitted to provide you with any advice or recommendations. These Market Commentaries should not be construed as a recommendation, advice or any attempt by Fortrade Canada Ltd. to prompt or influence you in making an investment decision to purchase, sell, hold or exchange any security or to influence the timing of such activity. This content is produced by Fortrade Limited which is not registered in any capacity with any securities regulatory authority in Canada.
70% of retail investor accounts lose money when trading CFDs with this provider.
CFDs are complex instruments and come with a high risk of losing money rapidly due to leverage. 70% of retail investor accounts lose money when trading CFDs with this provider. You should consider whether you understand how CFDs work and whether you can afford to take the high risk of losing your money.
70.41% of retail investor accounts lose money when trading CFDs with this provider.
CFDs are complex instruments and come with a high risk of losing money rapidly due to leverage. 70.41% of retail investor accounts lose money when trading CFDs with this provider. You should consider whether you understand how CFDs work and whether you can afford to take the high risk of losing all your money. Read full risk warning.
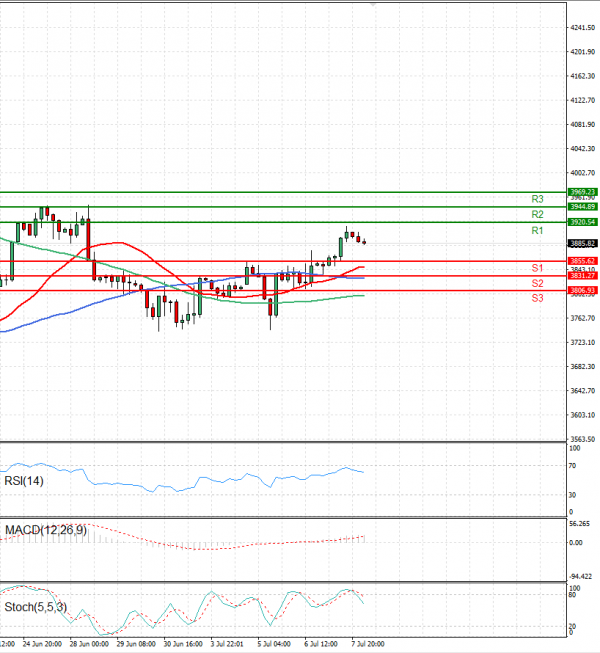
EU Session Analysis for CFD Instruments 08/07/2022
Fundamental analysis
08 July, 2022
Wall Street benchmarks ended up on Thursday, with the S&P 500 and Nasdaq recording their fourth successive higher closes, as traders leaned bought U.S. equities after the Federal Reserve hinted interest rate hikes could be tempered if growth suffered. U.S. stock markets have stabilized in July after a brutal selloff in the first half against the backdrop of a surge in inflation, the Ukraine conflict and the Fed's pivot away from easy-money policy. Elsewhere, a report on Thursday showed the number of Americans filing new claims for unemployment benefits unexpectedly rose last week and demand for labor is slowing with layoffs surging to a 16-month high in June. A closely watched employment report on Friday is expected to show nonfarm payrolls likely increased by 268,000 jobs last month after rising by 390,000 in May.