Fortrade Canada Ltd. as an order-execution only dealer is not permitted to provide you with any advice or recommendations. These Market Commentaries should not be construed as a recommendation, advice or any attempt by Fortrade Canada Ltd. to prompt or influence you in making an investment decision to purchase, sell, hold or exchange any security or to influence the timing of such activity. This content is produced by Fortrade Limited which is not registered in any capacity with any securities regulatory authority in Canada.
71% of retail investor accounts lose money when trading CFDs with this provider.
CFDs are complex instruments and come with a high risk of losing money rapidly due to leverage. 71% of retail investor accounts lose money when trading CFDs with this provider. You should consider whether you understand how CFDs work and whether you can afford to take the high risk of losing your money.
70.41% of retail investor accounts lose money when trading CFDs with this provider.
CFDs are complex instruments and come with a high risk of losing money rapidly due to leverage. 70.41% of retail investor accounts lose money when trading CFDs with this provider. You should consider whether you understand how CFDs work and whether you can afford to take the high risk of losing all your money. Read full risk warning.
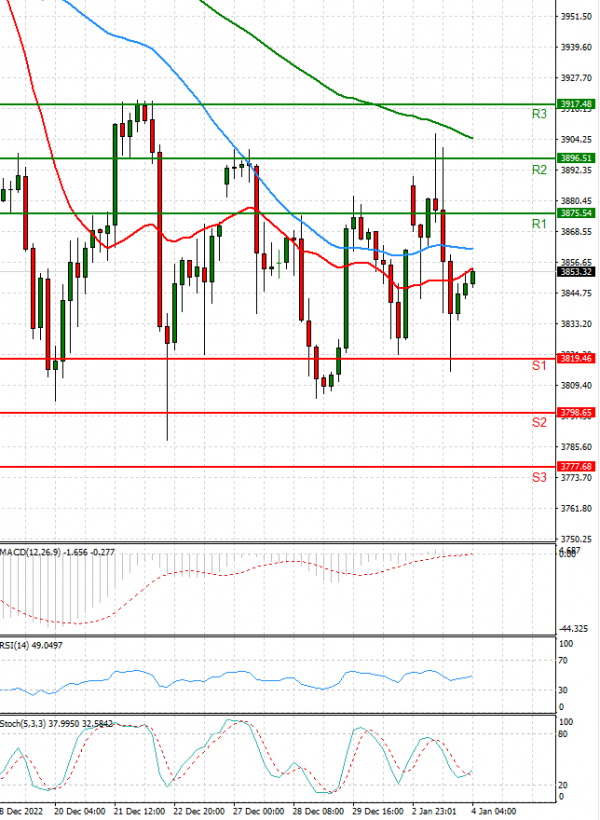
EU Session Analysis for CFD Instruments 04/01/2023
Fundamental analysis
04 January, 2023
Wall Street's main indexes closed lower on the first trading day of 2023 with big drags from Tesla and Apple, while investors worried about the Federal Reserve's interest-rate hiking path as they awaited minutes from its December meeting. Shares in electric vehicle maker Tesla Inc hit their lowest level since August 2020 after disappointing quarterly delivery numbers released over the weekend. Apple Inc shares sank, with the iPhone maker hitting its lowest level since June 2021, after a report from Nikkei Asia pointed to weaker demand.