CFDs are complex instruments and come with a high risk of losing money rapidly due to leverage. 71% of retail investor accounts lose money when trading CFDs with this provider. You should consider whether you understand how CFDs work and whether you can afford to take the high risk of losing your money.
CFDs are complex instruments and come with a high risk of losing money rapidly due to leverage. 70.91% of retail investor accounts lose money when trading CFDs with this provider. You should consider whether you understand how CFDs work and whether you can afford to take the high risk of losing all your money. Read full risk warning.

USA500 Analysis

EU Session Analysis for CFD Instruments 26/03/2024

Fundamental analysis

26 March, 2024

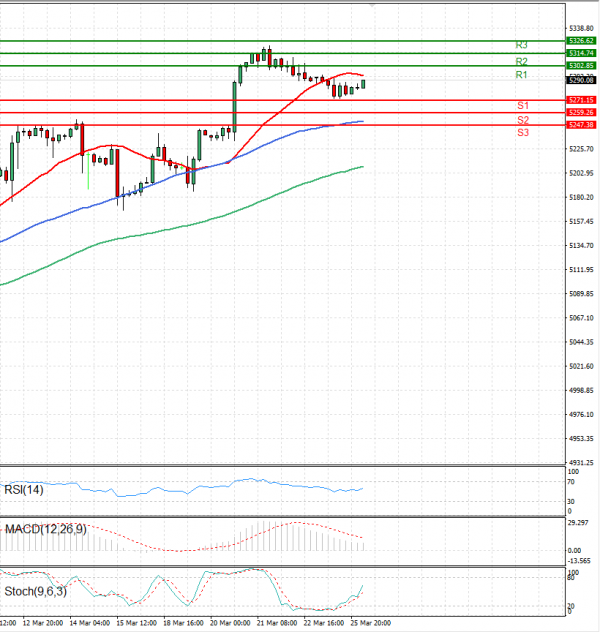
The USA500 is currently trading above 5,200 levels.

In evening trading on Monday, U.S. stock index futures showed slight gains, recovering some losses from a negative session on Wall Street.

Market sentiment remained cautious as investors awaited further signals on inflation and Federal Reserve policy. The aftermarket saw gains in major artificial intelligence stocks, reflecting optimism about the rapidly growing sector.

However, enthusiasm on Wall Street seemed to be waning after reaching record highs last week, partly due to a perceived dovish stance from the Federal Reserve. Additionally, regulatory actions against leading technology companies added to market concerns.

S&P 500 Futures edged up 0.1% to 5,283.50 points, while Nasdaq 100 Futures also rose 0.1% to 18,539.75 points. Dow Jones Futures climbed 0.1% to 39,722.0 points.

Technical analysis

USA500 Analysis Technical analysis 26/03/2024
Time Frame: 1 hour

USA500 Support & Resistance Table - 26/03/2024

Support & Resistance Level Explanation
Resistance 2 5314.74 Daily R2
Resistance 1 5302.85 Daily R1
Support 1 5271.15 Daily S1
Support 2 5259.26 Daily S2

USA500 Indicator Table - 26/03/2024

Indicator Signal
SMA 20 Sell
SMA 50 Buy
SMA 100 Buy
MACD( 12;26;9) Buy
RSI (14) Buy
Stochastic ( 9;6;3) Buy

USA500 Indicator / Period Table - 26/03/2024

Indicator / Period Day - BuyWeek - BuyMonth - Buy
MACD( 12;26;9) Buy BuyBuy
RSI (14) Buy BuyBuy
SMA 20 Sell BuyBuy

USA500 26/03/2024 - Reference Price : 5290.08

Buy
Simple Moving AverageBuy (2)Sell (1)
Technical Indicators - OscillatorsBuy (3)Sell (0)
Share It With Your Network
USA500 Chart
Update Time: -
Highest
Lowest
1M 5M H D W
Prices are loading..
Ready for trading?Start Now