CFDs are complex instruments and come with a high risk of losing money rapidly due to leverage. 69% of retail investor accounts lose money when trading CFDs with this provider. You should consider whether you understand how CFDs work and whether you can afford to take the high risk of losing your money.
CFDs are complex instruments and come with a high risk of losing money rapidly due to leverage. 67.52% of retail investor accounts lose money when trading CFDs with this provider. You should consider whether you understand how CFDs work and whether you can afford to take the high risk of losing all your money. Read full risk warning.

USA500 Analysis

EU Session Analysis for CFD Instruments 11/07/2024

Fundamental analysis

11 July, 2024

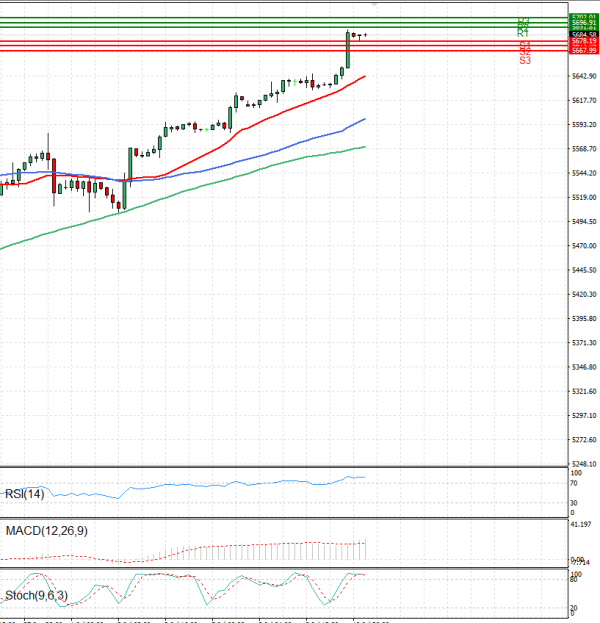
The USA500 is currently trading above 5,600 levels.

U.S. stock index futures dipped slightly in evening trading on Wednesday, easing after a recent rally on Wall Street as attention shifted to upcoming inflation data, which could pave the way for interest rate cuts by the Federal Reserve.

Wall Street surged on Wednesday following encouraging remarks from Fed Chair Jerome Powell, who acknowledged the recent cooling in the U.S. economy and mentioned that the central bank will consider neutral rates later in 2024.

S&P 500 Futures fell 0.1%, Nasdaq 100 Futures declined 0.1%, and Dow Jones Futures decreased 0.1%.

Technical analysis

USA500 Analysis Technical analysis 11/07/2024
Time Frame: 1 hour

USA500 Support & Resistance Table - 11/07/2024

Support & Resistance Level Explanation
Resistance 2 5696.91 Daily R2
Resistance 1 5671.81 Daily R1
Support 1 5678.19 Daily S1
Support 2 5673.09 Daily S2

USA500 Indicator Table - 11/07/2024

Indicator Signal
SMA 20 Buy
SMA 50 Buy
SMA 100 Buy
MACD( 12;26;9) Buy
RSI (14) Neutral
Stochastic ( 9;6;3) Sell

USA500 Indicator / Period Table - 11/07/2024

Indicator / Period Day - BuyWeek - BuyMonth - Buy
MACD( 12;26;9) Buy BuyBuy
RSI (14) Neutral BuyBuy
SMA 20 Buy BuyBuy

USA500 11/07/2024 - Reference Price : 5684.58

Buy
Simple Moving AverageBuy (3)Sell (0)
Technical Indicators - OscillatorsBuy (1)Sell (1)
Share It With Your Network
USA500 Chart
Update Time: -
Highest
Lowest
1M 5M H D W
Prices are loading..
Ready for trading?Start Now