ALUMINUM weekly special report based on 1.00 Lot Calculation:
ALUMINUM USE AND MARKET SHARE:
- Aluminum is widely used across multiple industries due to its lightweight, corrosion resistance, and recyclability. The construction sector is a major consumer (infrastructure, buildings), followed by transportation (automobiles, aircraft, ships) and packaging (cans, foils). It is also increasingly used in renewable energy technologies, such as solar panels and wind turbines, supporting long-term demand.
- MARKET SHARE (PRODUCERS): China dominates global aluminum production with around 60% of the market, followed by India at roughly 6%, Russia with about 5%, Canada at 4%, and the United Arab Emirates with around 4% of total global output.
- MARKET SHARE (CONSUMERS): China is the largest aluminum consumer with over 55% of global demand, followed by the United States (~8%), India (~6%), Japan (~3%), and Germany (~3%).
SUPPLY SIDE: DEFICIT EXPECTATIONS
- SUPPLY DEFICIT: The market was in a structural deficit of roughly 600,000 tons, with global inventories falling since 2024.
- CHINA PRODUCTION CAPACITY REMAINS LIMITED: China's production is operating near its 45-million-ton capacity cap, limiting the ability to increase supply to fill global gaps.
USA: SUPPLY SHORTAGES AFTER THEY IMPOSED 50% ON GLOBAL ALUMINUM IMPORTS
- 50% U.S. TARIFFS ON ALUMINUM REDUCED SUPPLY ACROSS THE USA. The United States produces only about 15–20% of the aluminum it consumes. The rest used to be imported from Canada, the United Arab Emirates, Bahrain, and Australia. Now that the prices are much higher for importers, the US has to rely more on its domestic production, which cannot increase quickly, creating a tighter market.
GEOPOLITICS: THE MIDDLE EAST WAR LIMITS ALUMINUM EXPORTS
- ENERGY PRICES RISE: Aluminum smelting requires huge amounts of electricity, which is often generated from natural gas or oil. If energy prices go up, then higher aluminum production costs could cause higher aluminum prices.
- THE STRAIT OF HORMUZ IS STILL EFFECTIVELY CLOSED: Around 20% of the total global oil supply and around 20%-25% of the total Liquefied Natural Gas (LNG) used to pass through the Strait of Hormuz each day. Now those numbers have gone down close to zero as the Hormuz Strait remained closed and made exporting countries in the region unable to export.
- MAJOR MIDDLE EAST ALUMINUM EXPORTERS: The United Arab Emirates (U.A.E.), Bahrain, Qatar, Saudi Arabia, and Oman are the largest aluminum exporters from the region. Their supplies account for around 8% of total global production. They mainly export aluminum to Europe, the U.S.A., Japan, and South Korea.
TECHNICAL ANALYSIS AND PRICE ACTION:
- ALUMINUM PRICE HIT ITS HIGHEST RATE SINCE MARCH 2022 ($3,532.75). Aluminum currently trades around $3,375, and if it fully recovers to its previous all-time high ($3,966), it could see an upside of around $590. However, the price could also decline.
- LONG-TERM TREND IS UP. The overall trend of aluminum is up (black trendline), with the trend accelerating since mid – September of 2025.
- SUPPORT AREA: $3,200 – $3,100. Aluminum prices have found a support zone in the range between $3,200 and $3,100. However, it could also decline.
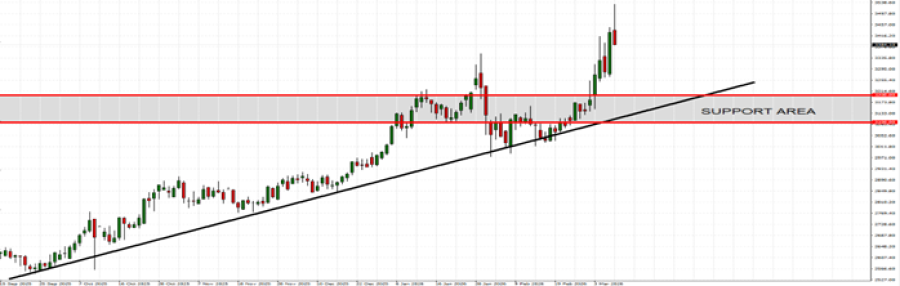
GRAPH (Daily): September 2025 – March 2026
Please note that past performance does not guarantee future results
ALUMINUM, March 9, 2026
Current Price: 3,375
|
ALUMINUM |
Weekly |
|
Trend direction |
|
|
4,000 |
|
|
3,800 |
|
|
3,600 |
|
|
3,200 |
|
|
3,150 |
|
|
3,100 |
Example of calculation base on weekly trend direction for 1.00 Lot1
|
ALUMINUM |
||||||
|
Pivot Points |
||||||
|
Profit or loss in $ |
62,500 |
42,500 |
22,500 |
-17,500 |
-22,500 |
-27,500 |
|
Profit or loss in €2 |
54,044 |
36,750 |
19,456 |
-15,132 |
-19,456 |
-23,779 |
|
Profit or loss in £2 |
46,816 |
31,835 |
16,854 |
-13,108 |
-16,854 |
-20,599 |
|
Profit or loss in C$2 |
84,600 |
57,528 |
30,456 |
-23,688 |
-30,456 |
-37,224 |
- 1.00 lot is equivalent of 100 units
- Calculations for exchange rate used as of 08:00 (GMT) 09/03/2026
There is a possibility to use Stop-Loss and Take-Profit.
- You may wish to consider closing your position in profit, even if it is lower than suggested one.
- Trailing stop technique could protect the profit.