APPLE (#APPLE) weekly special report based on 1 Lot Calculation:
APPLE: THE COMPANY
- APPLE is a technology company that produces iPhone smartphones, Mac personal computers, iPad tablets, iPod devices, etc.
- RECOGNIZED BRAND: iPhone. The iPhone is still Apple’s most profitable product, responsible for around 60% of the company’s total revenue.
- iPhone 17 RELEASED. The latest iPhone 17 model was released in September 2025 and began shipping in early Q4 2025. The model includes AI features as well.
- APPLE IS THE THIRD LARGEST COMPANY IN THE WORLD AFTER NVIDIA AND ALPHABET (GOOGLE). Valued at around 3.60 trillion dollars, Apple is the third-largest company in the world, sitting only behind NVIDIA and Alphabet (Google).
- STOCK INDEX PARTICIPATION: Apple’s stock is part of all three major indices such as the S&P 500 (USA500), Nasdaq 100 (USA100), and Dow Jones Industrial Average 30 (USA30).
APPLE: EVENTS
- EVENT (THURSDAY, JANUARY 29, AFTERMARKET): Q4 2025 EARNINGS REPORT. Apple is expected to print $138.35 billion in revenue for Q4 of 2025. This represents a 11% increase from the same period last year ($124.3 billion). In addition, the company is expected to post Net Income of $39.376 billion, which could be an increase of around 8% from the same period last year ($36.338 billion).
- QUARTERLY REVENUE AND NET INCOME (LAST 8 QUARTERS). Apple has beaten Revenue and Net Income expectations 8 out of the last 8 times.
- LAST TIME (Q3 RESULTS): Apple reported higher-than-expected revenue ($102.47 billion, an increase of 8%) and better-than-expected Net income ($24.98 billion, an increase of 10%). (Source: Bloomberg).
APPLE: STRONG IPHONE 17 SALES
- Apple Surpasses Samsung for the First Time in Over a Decade. According to Counterpoint Research’s preliminary Market Monitor report, Apple ended 2025 as the world’s top smartphone vendor by shipments, overtaking Samsung for the first time in more than a decade, with about 20% global market share versus Samsung’s 19%.
- Citi estimates that strong demand for the iPhone 17 models continued through the end of the 2025, helping Apple exceed earnings expectations. The bank projects roughly 82 million iPhones sold in the holiday quarter, above typical consensus forecasts. (Source: Barrons)
- According to International Data Corporation, Apple has shifted from a projected ~1% decline in China in 2025 to an estimated +3% growth, driven by demand for the iPhone 17 series.
TECHNICAL ANALYSIS AND PRICE ACTION:
- MID-TERM UPTREND: Since April 2025, Apple has been moving steadily upward, following the rising black trendline on the chart. Each time the price pulled back, it found support near this line and continued higher.
- KEY MOVING AVERAGE INDICATES UPTREND: The 200-day moving average (green) continues to slope upward, confirming that the longer-term trend remains positive.
- THE STOCK HIT AN ALL-TIME HIGH OF $287.94 ON DECEMBER 3, 2025. The stock currently trades around $248, about 16% below its all-time high.
- ANALYSTS' OPINION: Wedbush forecasts $350, Goldman Sachs forecasts $320, Morgan Stanley forecasts $315, and Citi forecasts $315.
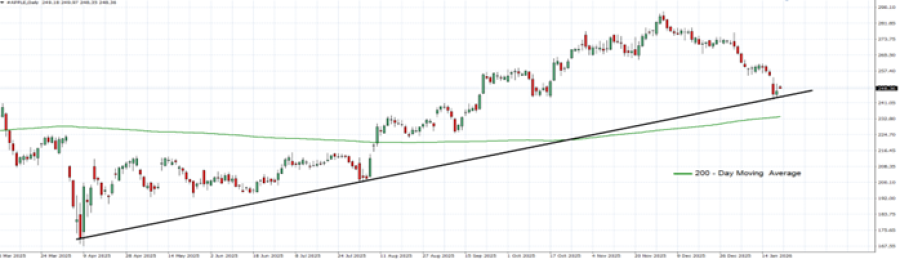
GRAPH (Daily): March 2025 – January 2026
Please note that past performance does not guarantee future results
#APPLE, January 22, 2026
Current Price: 248
|
Apple |
Weekly |
|
Trend direction |
|
|
300 |
|
|
285 |
|
|
265 |
|
|
233 |
|
|
230 |
|
|
225 |
Example of calculation based on weekly trend direction for 1.00 Lot1
|
Apple |
||||||
|
Pivot Points |
||||||
|
Profit or loss in $ |
5,200 |
3,700 |
1,700 |
-1,500 |
-1,800 |
-2,300 |
|
Profit or loss in €² |
4,443 |
3,161 |
1,453 |
-1,282 |
-1,538 |
-1,965 |
|
Profit or loss in £² |
3,875 |
2,757 |
1,267 |
-1,118 |
-1,341 |
-1,714 |
|
Profit or loss in C$² |
7,194 |
5,119 |
2,352 |
-2,075 |
-2,490 |
-3,182 |
- 1.00 lot is equivalent of 100 units
- Calculations for exchange rate used as of 10:20 (GMT) 22/1/2026
There is a possibility to use Stop-Loss and Take-Profit
- You may wish to consider closing your position in profit, even if it is lower than the suggested one.
- Trailing stop technique could protect the profit