Natural Gas weekly special report based on 1.00 Lot Calculation:
NATURAL GAS USE AND MARKET SHARE:
- NATURAL GAS is mainly used for electricity generation and heating. In the U.S., about 45% of homes use natural gas for heating.
- MARKET SHARE - PRODUCERS: BIGGEST NATURAL GAS PRODUCERS IN THE WORLD. The U.S. is the largest producer, with ~25% of the global market share, while Russia is the second with ~15% of the market. Iran is third with ~5%.
- MARKET SHARE - LNG (LIQUEFIED NATURAL GAS) EXPORTERS: The U.S. is the major LNG exporter, holding ~21% of the global market share, while Australia is the second with ~ 20% of the market. Qatar is third with ~20% and Russia fourth with ~ 8% of the global market.
- MARKET SHARE - CONSUMERS: The U.S. is the world's largest natural gas consumer, with ~ 22% of global consumption, while Russia holds ~ 11.6%, the EU ~11%, and China ~ 10.6%.
- MARKET SHARE - LNG- LIQUEFIED NATURAL GAS IMPORTERS: China is the world's largest LNG importer, with ~19-23.5% of global imports, Japan is second with ~ 16%- 18%, and the EU ~14%-15%. (Source: IEA)
GEOPOLITICS: MIDDLE EAST
- MIDDLE EAST TENSIONS REMAIN HIGH: US MILITARY EQUIPMENT CONTINUED TO BUILD UP IN THE MIDDLE EAST, NEAR IRAN. The US “USS ABRAHAM LINCOLN” carrier and its group are expected to arrive in the Middle East, near Iran, by the end of the current week. Other equipment and military assets remain on their way to the Middle East as well.
- BREAKING (JANUARY 22): 26TH DAY OF IRANIAN PROTESTS AND STREET CLASHES WITH IRAN’S FORCES.
STRAIT OF HORMUZ AT RISK: KEY LIQUEFIED NATURAL GAS (LNG) SUPPLY ROUTE. The Strait of Hormuz is a critical energy chokepoint through which 20–25% of global LNG exports pass, mainly from Qatar, one of the world’s largest LNG exporters. Rising tensions with Iran raise the risk that Tehran could attempt to block or disrupt traffic through the strait, which would significantly tighten global LNG supply and add upside pressure to natural gas prices.
US WEATHER FORECAST (LATE JANUARY / EARLY FEBRUARY)
- U.S. WEATHER FORECASTS: ARCTIC BLAST SET TO HIT THE U.S. DURING THE UPCOMING WEEKEND (JANUARY 24-JANUARY 25). This weekend (January 24 - 25), forecasters predict a winter storm with heavy snow and ice will extend from New Mexico to the East Coast. With that, Arctic air is forecast to plunge as far south as Texas. Wind chills are expected to range from as low as -45 °C in North Dakota and northern New England to near -18 Celsius in south central Texas. Expectations rose that a “freeze-off” would take place, which could cause a lower supply during times of strong winter demand for heating. It could affect 50 million people.
TECHNICAL ANALYSIS
- BREAKING (JANUARY 22): NATURAL HAS PRICE HIT ITS HIGHEST LEVELS IN MORE THAN THREE YEARS ($5.496): Natural gas prices have climbed to highs of $5.496, rising by more than 50% only this week, marking their highest level in more than three years. The move indicated improving short-term momentum. Although the price could fall, too.
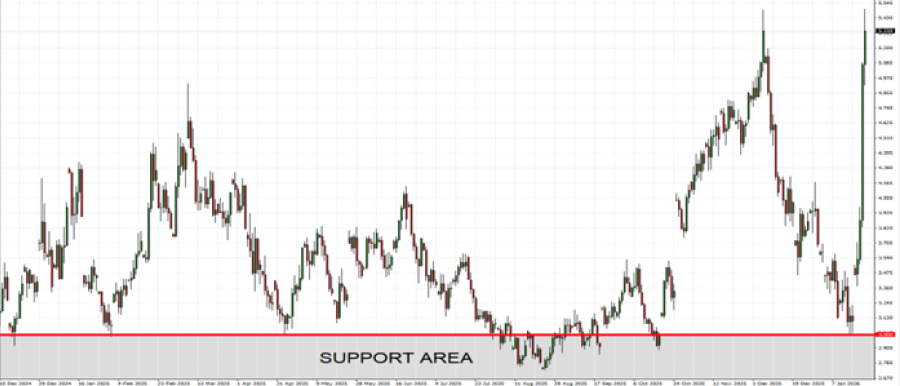
GRAPH (Daily): December 2024 – January 2026
Please note that past performance does not guarantee future results
Natural Gas, January 22, 2026
Current Price: 5.300
|
NATURAL GAS |
Weekly |
|
Trend direction |
|
|
9.000 |
|
|
8.000 |
|
|
7.000 |
|
|
3.700 |
|
|
3.400 |
|
|
3.000 |
Example of calculation based on weekly trend direction for 1.00 Lot1
|
NATURAL GAS |
||||||
|
Pivot Points |
||||||
|
Profit or loss in $ |
37,000 |
27,000 |
17,000 |
-16,000 |
-19,000 |
-23,000 |
|
Profit or loss in €² |
31,642 |
23,090 |
14,538 |
-13,683 |
-16,248 |
-19,669 |
|
Profit or loss in £² |
27,515 |
20,078 |
12,642 |
-11,898 |
-14,129 |
-17,104 |
|
Profit or loss in C$² |
51,147 |
37,323 |
23,500 |
-22,117 |
-26,264 |
-31,794 |
- 1.00 lot is equivalent of 10,000 units
- Calculations for exchange rate used as of 10:10 (GMT) 22/01/2026
There is a possibility to use Stop-Loss and Take-Profit.
- You may wish to consider closing your position in profit, even if it is lower than the suggested one.
- Trailing stop techniques could protect the profit.