AUD/USD Weekly Special Report Based on 1 Lot Calculation:
TECHNICAL ANALYSIS
- LONGER-TERM UPTREND CHANNEL: The chart indicates that AUD/USD has been trading within a rising channel since late May 2025, with higher highs and higher lows supporting the broader positive structure. The pair continues to respect the channel boundaries.
- 100-DAILY MOVING AVERAGE (MA): AUD/USD has recently bounced off its 100-day moving average, reinforcing it as dynamic support. The fact that the price remains above the 100-day MA confirms that bullish momentum is still intact. However, a clean break below this level could signal the beginning of a negative trend.
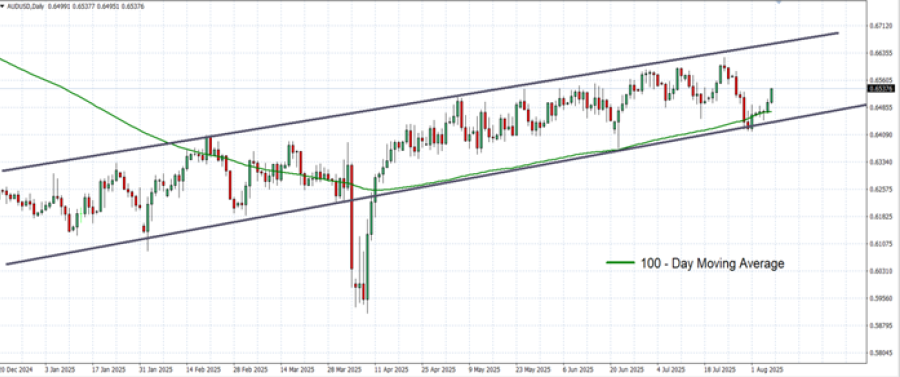
GRAPH (Daily): December 2024– August 2025
Please note that past performance does not guarantee future results.
EVENTS:
- TUESDAY, AUGUST 12 AT 13:30 GMT+1: US INFLATION (CPI) (JULY). A lower-than-expected reading could be negative for the US Dollar, as it could signal the Fed cutting interest rates sooner and more aggressively. This index measures the change in the prices of goods and services from the consumer's perspective. The data for the previous month (June) came in at 2.7%.
- FRIDAY, AUGUST 15 AT 13:30 GMT+1: US RETAIL SALES (JULY). A lower-than-expected reading could prove negative for the US Dollar, because it could motivate the FED to cut interest rates to stimulate economic activity. This data measures the change in the total value of sales at the retail level. The number for the previous month (June) stood at 3.92%.
GEOPOLITICS: TRADE PROGRESS
- AUSTRALIA’S TARIFF RATE WAS MAINTAINED AT 10%, in recognition of the long-standing Australia–United States Free Trade Agreement (AUSFTA), while many other countries got higher tariff rates, above 10%.
CENTRAL BANKS:
- TUESDAY, AUGUST 12 AT 5:30 GMT+1: RBA INTEREST RATE DECISION. The Reserve Bank of Australia (RBA) will announce its latest interest rate decision. Markets will be closely watching the outcome as the central bank assesses current economic conditions, inflationary pressures, and labor market trends. The current cash rate remains at 3.85%.
- WEDNESDAY, SEPTEMBER 17 AT 19:00 GMT+1: US FEDERAL RESERVE INTEREST RATE DECISION. After some weaker-than-expected employment market data in July and downward revisions to June figures, markets have increased their expectations for an interest rate cut in September, expected to be followed by another in December. The benchmark interest rate currently stands at 4.5%, and according to market expectations, it is expected to decline to 4% by the end of 2025. This could put negative pressure on the US dollar, and in turn support the AUD/USD currency pair.
AUDUSD, August 7, 2025.
Current Price: 0.6538
|
AUD/USD |
Weekly |
|
Trend direction |
|
|
0.6950 |
|
|
0.6800 |
|
|
0.6640 |
|
|
0.6450 |
|
|
0.6400 |
|
|
0.6350 |
Example of calculation based on weekly trend direction for 1.00 Lot1
|
AUD/USD |
||||||
|
Pivot Points |
||||||
|
Profit or loss in $ |
4,120 |
2,620 |
1,020 |
-880 |
-1,380 |
-1,880 |
|
Profit or loss in €² |
3,525 |
2,242 |
873 |
-753 |
-1,181 |
-1,608 |
|
Profit or loss in £² |
3,081 |
1,959 |
763 |
-658 |
-1,032 |
-1,406 |
|
Profit or loss in C$² |
5,348 |
3,401 |
1,324 |
-1,142 |
-1,791 |
-2,441 |
- 1.00 lot is equivalent of 100 000 units
- Calculations for exchange rate used as of 08:50 (GMT+1) 07/08/2025
There is a possibility to use Stop-Loss and Take-Profit
- You may wish to consider closing your position in profit, even if it is lower than the suggested one.
- Trailing stop technique could protect the profit