BRENT OIL Weekly Special Report based on 1 Lot Calculation:
BRENT OIL
- GLOBAL BENCHMARK: Brent crude is a main global oil benchmark, produced in the North Sea near the U.K. It is a seaborne oil benchmark and reflects global supply-demand dynamics. In contrast, WTI (West Texas Intermediate) (American Oil), produced in the United States, is landlocked and primarily reflects U.S. market conditions.
- BRENT OIL MORE VALUABLE THAN WTI (AMERICAN) OIL. Brent often trades at a premium due to its superior global accessibility and exposure to international market risks.
- SPREAD (PRICE DIFFERENCE) BETWEEN BRENT AND WTI (AMERICAN) OIL GETS WIDER WITH THE MIDDLE EAST WAR UNDERWAY. Brent is a seaborne global benchmark, with pricing closely tied to oil flows from key export regions such as the Middle East. Any disruption, whether to production, pipelines, or critical shipping routes like the Strait of Hormuz, directly affects global supply, could support Brent prices higher.
GEOPOLITICS: MIDDLE EAST WAR
- STRAIT OF HORMUTZ IS EFFECTIVELY CLOSED:
Around 20 million barrels of oil per day unable to reach global markets.
The latest attacks on ships mark an escalation in the conflict between Iran and the U.S. forces, raising the number of ships struck in the region since fighting began to at least 18.
Around 700 ships are stranded near the Strait of Hormuz, including about 400 oil tankers carrying roughly 200 million barrels of crude.
- CURRENT IMPACT: This represents ~20% of global oil demand, creating a major supply shock.
- SUPPLY LOSS ACCUMULATING: Over the last 19 days, since the war began, nearly 350 million barrels of oil exports have been disrupted.
- PRODUCTION SHUT DOWNS: 8-10 MILLION BARRELS OF OIL PER DAY. Approximately 8 to 10 million barrels per day of oil production has been stopped by several Gulf producers due to the conflict, including Saudi Arabia, Iraq, Kuwait and U.A.E.
Source: Reuters, CNBC, Bloomberg, OILPRICE.COM
PRICE ACTION: ANALYSTS’ OPINION
- BIG BANKS AND THEIR ESTIMATES IF THE CLOSURE OF THE HORMUTZ STRAIT PERSISTS:
JP MORGAN: $120
BARCLAYS: $100-$150
UBS: $100-150
CITIGROUP: $110-$120. In a bull scenario, prices could surge to $150-$200 if Iran targets more energy infrastructure or the Strait of Hormuz stays closed.
Source: Reuters, CNBC, Bloomberg, OILPRICE.COM
TECHNICAL ANALYSIS
- SUPPORT AREA: $90 – $100. After rising to its highest level since June 2022 ($119.43), Brent oil prices have now found support between the levels of $90 and $100. Since the war began, Brent oil has surged about 63%, reaching prices not seen in almost four years and pushing the market firmly above $100.
- BREAKING (MARCH 9): BRENT OIL PRICE HIT ITS HIGHEST RATE SINCE JUNE 2022 ($119.43). Brent oil price was last trading around $112, and if a full recovery to $119.43 follows, then crude oil prices may see an upside of around 7%. However, prices may decline as well.
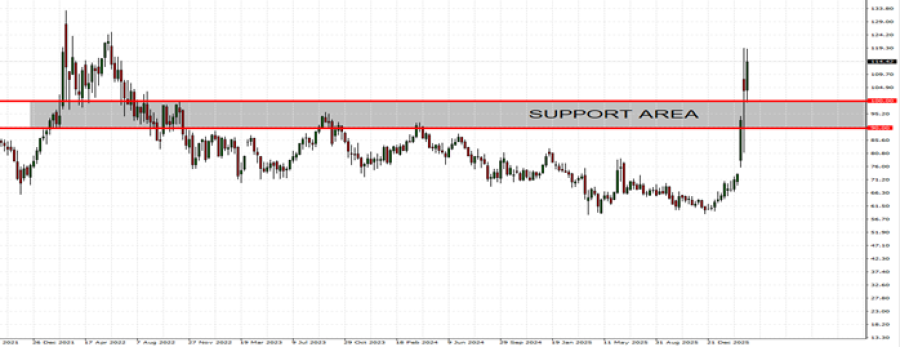
GRAPH (Weekly): November 2021 – March 2026
Please note that past performance does not guarantee future results
Brent Oil, March 19, 2026
Current Price: 112
|
Brent Oil |
Weekly |
|
Trend direction |
|
|
150 |
|
|
140 |
|
|
125 |
|
|
100 |
|
|
95 |
|
|
90 |
Example of calculation based on weekly trend direction for 1.00 Lot1
|
Brent Oil |
||||||
|
Pivot Points |
||||||
|
Profit or loss in $ |
38,000 |
28,000 |
13,000 |
-12,000 |
-17,000 |
-22,000 |
|
Profit or loss in €² |
33,107 |
24,395 |
11,326 |
-10,455 |
-14,811 |
-19,167 |
|
Profit or loss in £² |
28,608 |
21,080 |
9,787 |
-9,034 |
-12,798 |
-16,563 |
|
Profit or loss in C$² |
52,185 |
38,452 |
17,853 |
-16,480 |
-23,346 |
-30,213 |
- 1.00 lot is equivalent of 1000 units
- Calculations for exchange rate used a 11:00 (GMT) 19/3/2026
There is a possibility to use Stop-Loss and Take-Profit.
- You may wish to consider closing your position in profit, even if it is lower than the suggested one.
- Trailing stop techniques could protect the profit.