GOLD weekly special report based on 1.00 Lot Calculation:
TECHNICAL ANALYSIS AND PRICE ACTION
- 14- DAY RELATIVE STRENGTH INDEX (RSI) NEAR OVERSOLD LEVELS: Gold’s 14-Day RSI is currently around 32, approaching oversold threshold of 30, indicating that downward momentum may start losing strength and a short-term rebound could develop.
- SUPPORT AREA: $4,700. The recent decline has pushed gold prices down to a new key support level around $4,700. This area could act as a short-term floor, although a sustained break below it would signal further downside risk.
- BREAKING (MARCH 19): GOLD PRICES HAVE HIT THEIR LOWEST LEVELS IN ALMOST 7 WEEKS ($4,625).
- GOLD PRICE HIT A NEW ALL-TIME HIGH ON JANUARY 28, 2026 ($5,597.41). Gold currently trades around $4,625, and if it fully recovers to its previous all-time high, it could see an upside of around $970. However, the price could also decline.
- ANALYSTS’ OPINION: Wells Fargo forecasts $6,100; Bank of America forecasts $6,000; Goldman Sachs forecasts $5,400; Morgan Stanley forecasts $5,700; UBS forecasts $6,200; JPMorgan forecasts $6,300; Deutsche Bank forecasts $6,000; Societe General forecasts $6,000.
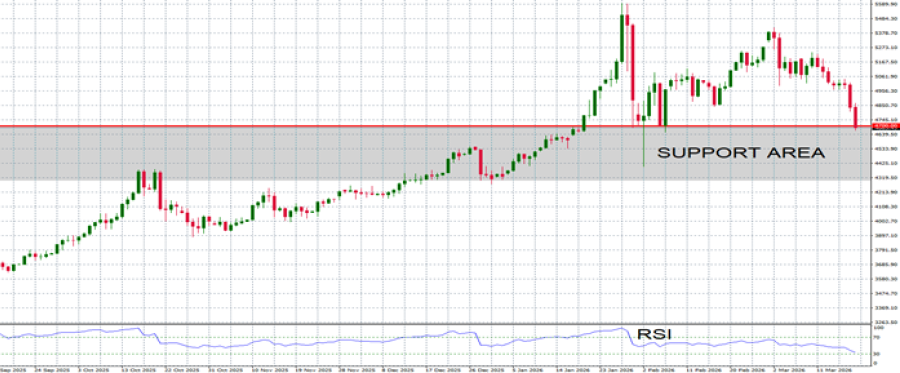
GRAPH (Daily): September 2025 – March 2026
Please note that past performance does not guarantee future results
GEOPOLITICS: MIDDLE EAST WAR CONTINUES TO ESCALATE
- MIDDLE EAST WAR: THIRD WEEK. The conflict between the U.S. and Iran has intensified, with sustained airstrikes on Iranian military targets and continued missile and drone attacks by Iran on U.S. bases and allied infrastructure across the Gulf. Iran has refused ceasefire negotiations while the U.S. continues large-scale military operations. According to U.S. officials, the conflict could continue for weeks as military pressure increases.
GOLD, March 19, 2026
Current Price: 4,625
|
GOLD |
Weekly |
|
Trend direction |
|
|
5,200 |
|
|
5,000 |
|
|
4,800 |
|
|
4,500 |
|
|
4,450 |
|
|
4,400 |
Example of calculation base on weekly trend direction for 1.00 Lot1
|
GOLD |
||||||
|
Pivot Points |
||||||
|
Profit or loss in $ |
57,500 |
37,500 |
17,500 |
-12,500 |
-17,500 |
-22,500 |
|
Profit or loss in €2 |
50,097 |
32,672 |
15,247 |
-10,891 |
-15,247 |
-19,603 |
|
Profit or loss in £2 |
43,288 |
28,232 |
13,175 |
-9,411 |
-13,175 |
-16,939 |
|
Profit or loss in C$2 |
78,965 |
51,499 |
24,033 |
-17,166 |
-24,033 |
-30,899 |
- 1.00 lot is equivalent of 100 units
- Calculations for exchange rate used as of 12:00 (GMT) 19/03/2026
There is a possibility to use Stop-Loss and Take-Profit.
- You may wish to consider closing your position in profit, even if it is lower than suggested one.
- Trailing stop technique could protect the profit.