BROADCOM (#BROADCOM) weekly special report based On 1.00 Lot Calculation:
GLOBAL SEMICONDUCTOR INDUSTRY
- THE SEMICONDUCTOR INDUSTRY IS WORTH ~$520B. The global semiconductor market size was valued at around USD 520 billion in 2023 and is expected to reach around USD 1,883.7 billion by 2032. Analysts are forecasting that at the current growth rate, the semiconductor industry is expected to reach $1.9 trillion in value, representing an industry annual growth of 12.28% from 2023 to 2032.
BROADCOM: THE COMPANY
- Broadcom Inc. is a major player in the semiconductor market, particularly in networking chips, wireless communication chips (including Wi-Fi and Bluetooth), broadband, and storage solutions. As of June 2024, Broadcom has a market cap of $839.05 Billion which makes it the world's 11th most valuable company by market cap. China’s ByteDance announced cooperation with Broadcom in developing an advanced AI processor.
BROADCOM: REVENUE AND NET INCOME (LAST THREE YEARS)
- The table below shows that Broadcom’s annual revenue has grown 14.58% on average over the past three years, while the company’s net income has grown 68.6% annually over the past 3 years.
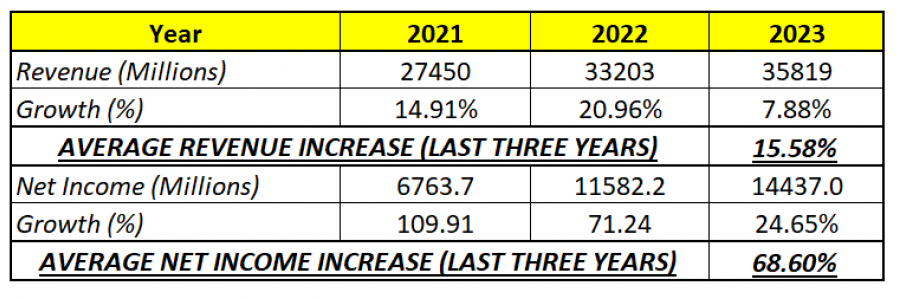
DATA SOURCE: Bloomberg
BROADCOM: ANALYSIS AND EVENTS
- EVENT: (STOCK SPLIT: 10 TO 1): EFFECTIVE ON ( JULY 15TH, 2024): Broadcom announced, announced a 10-for-one split of its common stock on June 12, 2024. This would be the first stock split for the company. As a reason for this, the company said it wants to make its stocks more accessible to employees and a broader range of investors.
- BROADCOM STOCK REACTION ON STOCK- SPLIT ANNOUNCEMENT: After June 12th, when the stock split was announced the stock price went up 23.4% in the next three days to reach the record high level of $1849.39 (Source: Bloomberg).
STOCK SPLIT PERFORMANCE (HISTORICAL DATA)
● PERFORMANCE BEFORE THE STOCK SPLIT (TIME FRAME: ANNOUNCEMENT DATE TO STOCK SPLIT) (SOURCES: YahooFinance, Bloomberg, Fortrade MT4):
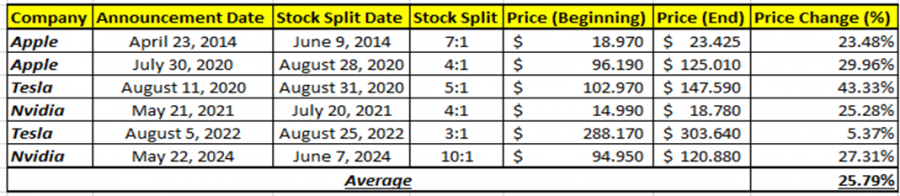
Please note that past performance does not guarantee future results
● STOCK PERFORMANCE AFTER STOCK SPLIT (SOURCES: YahooFinance, Bloomberg, Fortrade MT4):
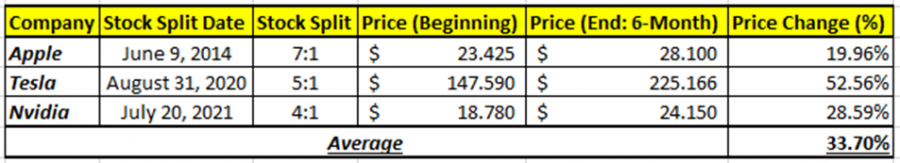
Please note that past performance does not guarantee future results
STOCK PRICE ACTION:
● STOCK PRICE ACTION: Broadcom is currently trading around $1661. If it fully recovers to its record high, it would result in an 11.34% increase. The price could also decline further.
BROADCOM, June 24, 2024
Current Price: 1,661.00
|
Broadcom |
Weekly |
|
Trend direction |
|
|
3,000.000 |
|
|
2,400.000 |
|
|
1,850.000 |
|
|
1,500.000 |
|
|
1,450.000 |
|
|
1,400.000 |
Example of calculation based on weekly trend direction for 1.00 Lot1
|
Broadcom |
||||||
|
Pivot Points |
||||||
|
Profit or loss in $ |
133,900.00 |
73,900.00 |
18,900.00 |
-16,100.00 |
-21,100.00 |
-26,100.00 |
|
Profit or loss in €² |
124,840.34 |
68,899.93 |
17,621.23 |
-15,002.00 |
-19,672.38 |
-24,334.08 |
|
Profit or loss in £² |
105,717.76 |
58,346.10 |
14,922.07 |
-12,711.25 |
-16,659.03 |
-20,606.67 |
|
Profit or loss in C$² |
183,108.92 |
101,058.62 |
25,845.84 |
-22,025.77 |
-28,854.36 |
-35,691.88 |
- 1.00 lot is equivalent of 100 units
- Calculations for exchange rate used as of 10:50 (GMT) 24/06/2024
Fortrade recommends the use of Stop-Loss and Take-Profit, please speak to your Senior Account ManagerClient Manager regarding their use.
- You may wish to consider closing your position in profit, even if it is lower than suggested one
- Trailing stop technique can protect the profit – Ask your Senior Account ManagerClient Manager for more detail