Copper Weekly Special Report based on 1 Lot Calculation:
TECHNICAL ANALYSIS:
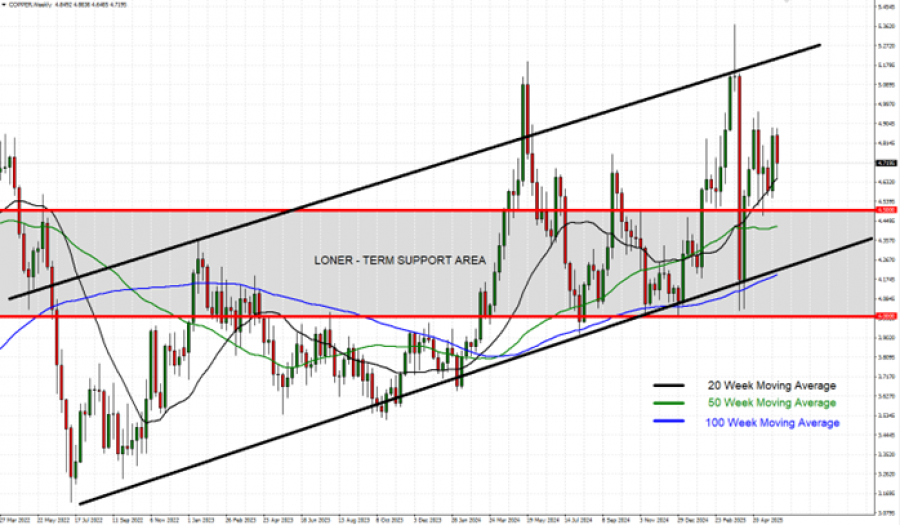
- SHORT-TERM SUPPORT AREA BELOW THE PSYCHOLOGICAL MARK OF $4.50: Copper has maintained strong support in the area between the level of $4.5 and $4.0, as shown by the weekly chart below.
- WEEKLY MOVING AVERAGES POINT TO UPTREND: Copper prices have recently traded above the 20-, 50-, and 100-Week Moving Averages, pointing to an ongoing uptrend. However, Copper prices can also change their trend if prices fall below the 20-, 50-, and 100-Week Moving Averages.
- LONGER-TERM UPTREND CHANNEL: The black trend lines, describing the uptrend channel, are depicted on the chart below. Copper prices have maintained their uptrend in general since July 2022.
- RESISTANCE AND SUPPORT LEVELS: Copper has remained in an uptrend, looking at Resistance 1 of $4.90, Resistance 2 of $4.95, and Resistance 3 of $5.00 to the upside. On the downside, Copper looks at Support 1 of $4.50, then towards Support 2 of $4.45 and Support 3 of $4.40.
GRAPH (Daily): July 2022 - May 2025
Please note that past performance does not guarantee future results
PRICE ACTION:
- COPPER HIT AN ALL-TIME HIGH OF $5.3702 (March 26, 2025). Copper currently trades around $4.70, and if a full recovery takes place, then copper prices could see an upside of 14%. However, copper prices could decline as well.
SUPPLY - DEMAND SIDE:
- TOP COPPER PRODUCERS: The biggest producers of copper are: Chile (27% of the world total), China (8%), Peru (8%), the Democratic republic of Congo (6%), Australia (5%), Mexico (5%), Russia (3%), and Canada (2%).
- TOP COPPER CONSUMERS: The biggest consumers of copper are: China (52% of the world’s total), the United States (7%), the European Union (8%), and Japan (4%).
- TOP COPPER INDUSTRIES: Copper is heavily demanded in the EV industry, renewable energy industry (wind and solar farms), electrical infrastructure, telecommunications, and construction. The EV and green industries show the biggest growth rates (10-15% and 5%, respectively) and are expected to push the overall copper growth rate even higher in the future.
EVENTS (CHINA):
- SATURDAY, MAY 31 AT 02:30 GMT+1: CHINA MANUFACTURING PMI (MAY): A stronger-than-expected PMI reading could support copper prices, as it would indicate improving industrial activity in China, the world’s largest consumer of copper, and therefore it would raise expectations for increased demand. (EXPECTED: 49.5; PREVIOUS: 49 down from 50.5)
EVENTS (USA):
- FRIDAY, JUNE 6, AT 13:30 GMT+1: US NONFARM PAYROLLS (NFP) AND UNEMPLOYMENT RATE (MAY): In April, NFP came in at 177K (vs. 138K expected), while the unemployment rate held steady at 4.2%—the same as in March. If the unemployment rate continues its upward trend (4.0% in January, 4.1% in February, and 4.25.% in March and April), it could weaken the US dollar, potentially supporting higher copper prices.
COPPER, May 29, 2025
Current Price: 4.70
|
COPPER |
Weekly |
|
Trend direction |
|
|
5.00 |
|
|
4.95 |
|
|
4.90 |
|
|
4.50 |
|
|
4.45 |
|
|
4.40 |
Example of calculation based on weekly trend direction for 1.00 Lot1
COPPER
|
Pivot Points |
||||||
|
Profit or loss in $ |
3,000 |
2,500 |
2,000 |
-2,000 |
-2,500 |
-3,000 |
|
Profit or loss in €2 |
2,646 |
2,205 |
1,764 |
-1,764 |
-2,205 |
-2,646 |
|
Profit or loss in £2 |
2,224 |
1,853 |
1,483 |
-1,483 |
-1,853 |
-2,224 |
|
Profit or loss in C$2 |
4,139 |
3,449 |
2,759 |
-2,759 |
-3,449 |
-4,139 |
- 1.00 lot is equivalent of 10 000 units
- Calculations for exchange rate used as of 14:19 (GMT+1) 29/05/2025
There is a possibility to use Stop-Loss and Take-Profit.
- You may wish to consider closing your position in profit, even if it is lower than the suggested one.
- Trailing stop technique could protect the profit