Copper Weekly Special Report based on 1 Lot Calculation:
SUPPLY SIDE:
- WORLD’S TOP COPPER PRODUCERS:
- Chile – about 23% of global output.
- Democratic Republic of Congo - 12% to 14% of global output.
- Peru – 11% to 12% of global output.
- China – around 7.5%.
- United States- around 4.6%.
- WORLD’S LARGEST MINES:
- Escondida (Chile): 8% of global supply.
- Grasberg (Indonesia): 6-7% of global supply.
- Collahuasi (Chile): 2-3% of global supply.
- Kamoa-Kakula (Democratic Republic of Congo): 2-3% of global supply.
- BREAKING NEWS (SEPTEMBER 24 - 25): THE SECOND LARGEST COPPER MINE IN THE WORLD IS NOW SHUT DOWN. Located in Indonesia and operated by the US company Freeport, Grasberg is the second-largest copper mine in the world. The mine is responsible for 6% to 7% of the total global supply. The mud rush accident in September has closed down around 70% of the total operating capacity of the Grasberg copper mine.
ANALYSTS’ OPINION
- CITIGROUP SEES COPPER AT $5.57 WITHIN A YEAR, DRIVEN BY AI EXPANSION. Citigroup reaffirmed its bullish stance on copper, setting a $5.57 per ounce target over the next 6–12 months, about 20% above current levels.
- MORGAN STANLEY: Copper prices are set to stay elevated as supply disruptions and a weakening U.S. dollar tighten the market into 2026, according to Morgan Stanley.
- GOLDMAN SACHS REVISED DOWN COPPER OUTPUT FORECASTS. Goldman Sachs, following the accident in Grasberg, revised downward copper mining growth from 0.8% to 0.2% in 2025 and from 2.2% to 1.9% in 2026.
DEMAND SIDE: DEMAND TO SURGE WITH BOOMING AI INDUSTRY
- COPPER USE IN AI INDUSTRY: Copper is essential in high-performance servers, advanced semiconductors, cooling systems, and the massive data centers that power AI models. Each large-scale data center requires tens of thousands of miles of copper wiring to ensure efficient power transmission and heat management. With accelerating investment in AI infrastructure and supportive macro conditions, demand is expected to rise sharply, reinforcing the positive case for higher prices (Source: Bloomberg).
EVENTS:
- MONDAY, OCTOBER 13 AT 05:00 GMT+1: CHINA TRADE BALANCE AND EXPORT/IMPORT DATA (SEPTEMBER). A stronger-than-expected trade surplus, particularly if driven by resilient industrial export and import figures, could reinforce expectations of steady Chinese copper demand, support prices, and potentially extend the recent rebound. Conversely, a weaker outcome could pressure prices lower. China remains one of the world’s largest copper consumers, making this data especially significant.
TECHNICAL ANALYSIS:
- UPTREND AND RECOVERY SINCE EARLY AUGUST 2025: Copper prices have traded within an uptrend channel since early August, as depicted by the daily chart below. However, there remains a risk of a potential breakout below this level if market conditions change.
- COPPER PRICE ABOVE ITS DAILY MOVING AVERAGES: Copper price is holding steadily above its 20, 50, and 100 daily moving averages, clearly pointing to an uptrend.
- COPPER PRICE HIT AN ALL-TIME HIGH OF $5.9552 (July 24, 2025): The copper price currently trades around $5.1700, and if a full recovery occurs, then copper prices could see an upside of around 15%. Although the price could decline, too.
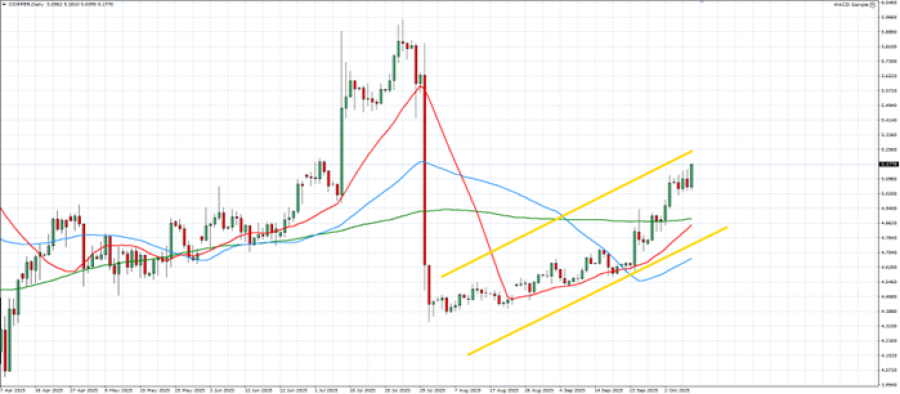 GRAPH (Daily): April 2025 - October 2025
Please note that past performance does not guarantee future results
COPPER, October 9, 2025.
Current Price: 5.1700
|
COPPER |
Weekly |
|
Trend direction |
|
|
5.9552 |
|
|
5.6500 |
|
|
5.4000 |
|
|
4.9500 |
|
|
4.9000 |
|
|
4.8500 |
Example of calculation based on weekly trend direction for 1.00 Lot1
|
COPPER |
||||||
|
Pivot Points |
||||||
|
Profit or loss in $ |
7,852 |
4,800 |
2,300 |
-2,200 |
-2,700 |
-3,200 |
|
Profit or loss in €² |
6,756 |
4,130 |
1,979 |
-1,893 |
-2,323 |
-2,753 |
|
Profit or loss in £² |
5,869 |
3,588 |
1,719 |
-1,644 |
-2,018 |
-2,392 |
|
Profit or loss in C$² |
10,952 |
6,695 |
3,208 |
-3,069 |
-3,766 |
-4,463 |
- 1.00 lot is equivalent of 10 000 units
- Calculations for exchange rate used as of 8:30 (GMT+1) 09/10/2025
There is a possibility to use Stop-Loss and Take-Profit
- You may wish to consider closing your position in profit, even if it is lower than the suggested one.
- Trailing stop technique could protect the profit