Copper Weekly Special Report based on 1 Lot Calculation:
COPPER USE AND MARKET SHARE:
- TOP COPPER PRODUCERS: Chile (27% of the world total), China (8%), Peru (8%), the Democratic Republic of Congo (6%), Australia (5%), Mexico (5%), Indonesia (4%), Russia (3%), and Canada (2%).
- TOP COPPER CONSUMERS: China (52% of the world’s total), the United States (7%), the European Union (8%), and Japan (4%).
- TOP COPPER INDUSTRIES: Copper is heavily demanded in the EV industry, renewable energy industry (wind & solar farms), electrical infrastructure, telecommunications, and construction. The EV and green industries show the biggest growth rates (10-15% and 5%, respectively).
COPPER MARKET: TIGHT SUPPLY AND RISING DEMAND SUPPORT 2026 OUTLOOK
- MARKET BALANCE: COPPER MARKET EXPECTED TO BE IN DEFICIT IN 2026. Ongoing mine disruptions around the world and declining ore grades continue to restrict supply growth, while demand remains supported by electrification and A.I. infrastructure needs.
- INDUSTRIAL DEMAND: ELECTRIFICATION, MILITARY, AND A.I. INFRASTRUCTURE INVESTMENT INCREASES DEMAND. Copper demand remains structurally strong, supported by power grid expansion, renewable energy projects, A.I. Data centers construction, electric vehicles, rising industrial activity, and increased military spending, all reinforcing the demand outlook into 2026.
INCREASED GLOBAL DEFENCE SPENDING ADDS TO STRUCTURAL DEMAND SUPPORT
- RISING GLOBAL DEFENCE BUDGETS BOOST COPPER DEMAND. Increased military spending across the U.S., Europe, and Asia is driving higher demand for copper-intensive equipment, including vehicles, naval vessels, aircraft, and weapons systems, all of which rely heavily on copper for wiring and electronics.
- MILITARY MODERNISATION AND REARMAMENT SUPPORT LONG-TERM CONSUMPTION. Ongoing rearmament programs and the modernization of defence infrastructure require large volumes of copper for communications networks, radar systems, and ammunition production, adding a new layer of steady demand into 2026.
- GEOPOLITICAL TENSIONS REINFORCE DEMAND OUTLOOK. Heightened geopolitical risks are pushing governments to accelerate defence investment timelines, increasing near- and medium-term copper consumption and reinforcing a positive price outlook alongside already tight supply conditions.
EVENTS:
- MONDAY, JANUARY 19 AT 02:00 GMT: CHINA GROSS DOMESTIC PRODUCT (GDP) (Q4). Stronger-than-expected GDP growth would indicate improving economic momentum in China, supporting industrial production and infrastructure investment, both key drivers of copper demand.
- MONDAY, JANUARY 19 AT 02:00 GMT: CHINA INDUSTRIAL PRODUCTION (DECEMBER). A stronger industrial production reading would point to expanding factory output in China, reinforcing demand for copper used in machinery, power networks, and infrastructure development.
TECHNICAL ANALYSIS:
- UPTREND AND RECOVERY SINCE EARLY AUGUST 2025: Copper prices have traded within an uptrend channel since early August, as depicted by the daily chart below. However, there remains a risk of a potential breakout below this level if market conditions change.
- DAILY MOVING AVERAGES POINT TO UPTREND: Copper prices have recently traded above the 20-, 50-, and 100-Daily Moving Averages, pointing to an ongoing uptrend. However, Copper prices can also change their trend if prices fall below the 20-, 50-, and 100-Daily Moving Averages.
- SUPPORT AREA: $5.60 – $5.70. This zone represents an important psychological support area for copper prices.
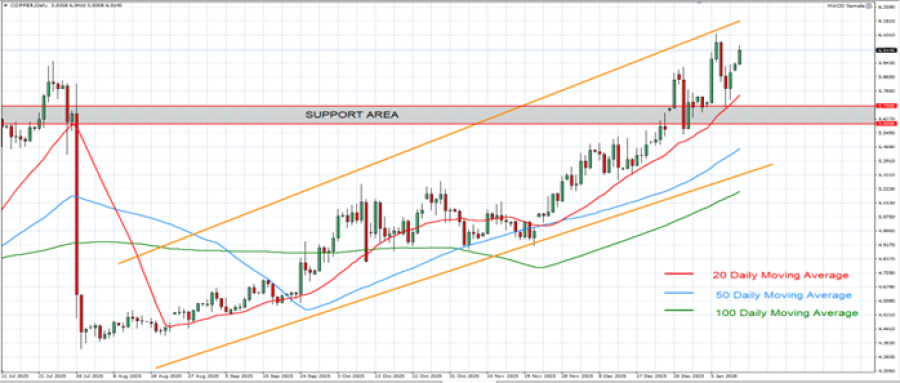
GRAPH (Daily): July 2025 - January 2026
Please note that past performance does not guarantee future results
COPPER, January 12, 2026
Current Price: 6.000
|
COPPER |
Weekly |
|
Trend direction |
|
|
6.600 |
|
|
6.500 |
|
|
6.400 |
|
|
5.700 |
|
|
5.650 |
|
|
5.600 |
Example of calculation based on weekly trend direction for 1.00 Lot1
|
COPPER |
||||||
|
Pivot Points |
||||||
|
Profit or loss in $ |
6,000 |
5,000 |
4,000 |
-3,000 |
-3,500 |
-4,000 |
|
Profit or loss in €² |
5,138 |
4,282 |
3,425 |
-2,569 |
-2,997 |
-3,425 |
|
Profit or loss in £² |
4,461 |
3,717 |
2,974 |
-2,230 |
-2,602 |
-2,974 |
|
Profit or loss in C$² |
8,330 |
6,942 |
5,554 |
-4,165 |
-4,859 |
-5,554 |
- 1.00 lot is equivalent of 10 000 units
- Calculations for exchange rate used as of 12:00 (GMT) 12/1/2026
There is a possibility to use Stop-Loss and Take-Profit
- You may wish to consider closing your position in profit, even if it is lower than the suggested one.
- Trailing stop technique could protect the profit