Crude Oil weekly special report based On 1.00 Lot Calculation:
TECHNICAL REVIEW:
- STATISTICS: CRUDE OIL HAS TESTED THE RANGE OF $62- $70 FOUR TIMES SINCE FEBRUARY 2021. This is the fifth time trying to test the region. After testing the region, Crude oil would come back up, to target the $80- $90 range.
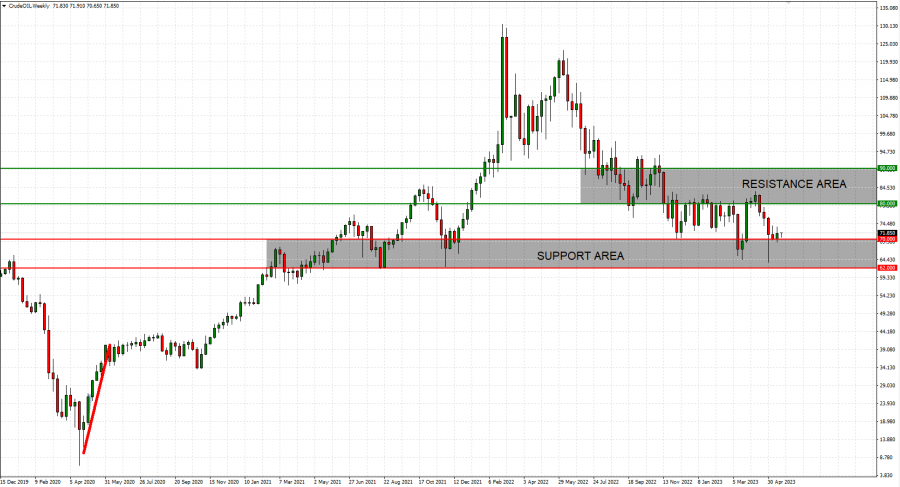
Graph (Weekly): Crude Oil
Please note that past performance does not guarantee future results.
EVENT (JUNE 3-4): OPEC, OPEC+ MEETING: OIL PRODUCTION DECISION. The OPEC+ consist of some of the largest oil producers in the world such as Saudi Arabia and Russia. The OPEC+ controls around 48% of the global oil supply and as such it could have a strong impact on the oil prices. Last time (early April), when OPEC+ decided to cut further their oil production by 1.6 million barrels a day, the oil prices jumped immediately by around 9.00%.
DOWNWARD PRESSURE LOOKS CONTROLLED BY TWO MAIN FACTORS:
- US STRATEGIC PETROLEUM RESERVES (SPR) TO REFILL AT $68 - $72. NEXT POTENTIAL TIMING: Q3, 2023. The Biden administration will start buying crude to replenish the strategic petroleum reserve when prices fall to $68- $72 per barrel. President Biden ordered the release of a total of 180 million barrels of crude this year in response to a price rally caused by Russia’s invasion of Ukraine. Currently, the Strategic Petroleum Reserves stand at 371.6 million barrels, its lowest since early 1980’s.
- SAUDI ARABIA: Saudi Arabia, de facto OPEC leader, maintains a fiscal breakeven oil price of around $80 a barrel.
OIL MARKETS ARE STILL EXPECTED TO GET INTO DEFICIT:
- OPEC+ STARTS OIL PRODUCTION CUTS IN MAY, 2023. Global oil supply could be expected to significantly fall in the months ahead.
- US DRIVING SEASON STARTS AT THE END OF MAY UNTIL EARLY SEPTEMBER. When the driving season in the US, the largest petroleum consumer in the world, gets underway analysts see higher consumption and therefore higher demand.
- CHINA’S ECONOMY KEEPS RECOVERING ALONG WITH SURGING OIL DEMAND. China reported stronger than expected pace of economic recovery in Q1 of 2023. Data showed that their economy rose by 4.5% in Q1 amid expectation for an increase of 4.00%. Stronger China economy implies higher oil demand, as China remains to be the largest oil importer in the world (importing more than 11 million barrels a day) and second largest oil consumer in the world (expected to consume a record 16 million barrels a day in 2023)
- DEFICIT CREATION: FALLING SUPPLY AMID RISING DEMAND COULD CREATE A DEFICIT. The above analyzed points show that demand could be expected to outpace supply, creating a hole that is known as deficit. According to Goldman Sachs, that deficit could be as much as 1.5 million barrels a day.
ANALYST OPINION:
- JPMorgan forecasts $94 in 2023. Goldman Sachs predicts $95 by the end of the year. UBS forecasts $95 a barrel. Bank of America forecasts oil at $90 a barrel.
Crude Oil, May 22, 2023
Current Price:71.30
|
Crude Oil |
Weekly |
|
Trend direction |
|
|
90.00 |
|
|
80.00 |
|
|
76.00 |
|
|
66.50 |
|
|
63.50 |
|
|
62.00 |
Example of calculation base on weekly trend direction for 1.00 Lot1
|
Crude Oil |
||||||
|
Pivot Points |
||||||
|
Profit or loss in $ |
18,800 |
8,800 |
4,800 |
-4,700 |
-7,700 |
-9,200 |
|
Profit or loss in €2 |
17,385 |
8,138 |
4,439 |
-4,346 |
-7,120 |
-8,507 |
|
Profit or loss in £2 |
15,100 |
7,068 |
3,855 |
-3,775 |
-6,185 |
-7,390 |
|
Profit or loss in C$2 |
25,396 |
11,887 |
6,484 |
-6,349 |
-10,401 |
-12,428 |
1. 1.00 lot is equivalent of 1000 units
2. Calculations for exchange rate used as of 12:50 (GMT+1) 22/05/2023
Fortrade recommends the use of Stop-Loss and Take-Profit, please speak to your Senior Account ManagerClient Manager regarding their use.
- You may wish to consider closing your position in profit, even if it is lower than suggested one
- Trailing stop technique can protect the profit – Ask your Senior Account ManagerClient Manager for more detail