CRUDE OIL Weekly Special Report based on 1 Lot Calculation:
GEOPOLITICS: MIDDLE EAST WAR
- STRAIT OF HORMUZ EFFECTIVELY CLOSED: Around 20 million barrels of oil per day are unable to reach global markets.
- CURRENT IMPACT: This represents around 20% of global oil demand, creating a major supply shock.
- SUPPLY LOSS ACCUMULATING: Over the last 10 days, since the war began, nearly 200 million barrels of oil exports have been disrupted.
- THIS COMPARED TO THE WORLD'S STRATEGIC RESERVES:
INTERNATIONAL ENERGY AGENCY (IEA): This equals roughly 17% of total IEA emergency oil stocks.
U.S.A. (SPR): Comparable to U.S. strategic reserves, the disruption equals about 50% of the U.S. Strategic Petroleum Reserve (SPR).
- OPEC PRODUCTION DOWN AROUND 24.5% FROM THE GULF REGION
SUMMARY OF OIL PRODUCTION CUTS SO FAR IN THE REGION:
- SAUDI ARABIA: 2 to 2.5 million barrels a day of production cuts.
- IRAQ: 3.2 million barrels a day production cut.
- KUWAIT: 0.59 million barrels a day, but it may extend to a 1.09 million barrels a day production cut.
- U.A.E.: around 0.7 million barrels a day production cut.
- BAHRAIN: Bahrain declared force majeure after the refinery attack, which was able to produce more than 200,000 barrels a day of oil.
- TOTAL OIL PRODUCTION CUTS: around 7 million barrels a day of oil production cuts.
OPEC: THE CURRENT OIL PRODUCTION CUTS ARE EQUAL TO AROUND 24.5% OF TOTAL OPEC OIL PRODUCTION BEFORE THE WAR.
OPEC+: THE CURRENT OIL PRODUCTION CUTS ARE EQUAL TO AROUND 17% OF TOTAL OPEC+ OIL PRODUCTION BEFORE THE WAR.
Source: Bloomberg, Reuters, CNBC, OILPRICE.COM
PRICE ACTION: ANALYSTS’ OPINION
- BIG BANKS AND THEIR ESTIMATES IF THE CLOSURE OF THE HORMUZ STRAIT PERSISTS:
- JP MORGAN: $120
- BARCLAYS: $100-$150
- GOLDMAN SACHS: $100
- UBS: $120
Source: Reuters, CNBC, Bloomberg, OILPRICE.COM
TECHNICAL ANALYSIS
- SUPPORT AREA: $80. After rising to its highest level since June 2022 ($119.40), crude oil prices have now found support around the $80 level or below. Since the war began, crude oil has surged about 77%, reaching prices not seen in almost four years and pushing the market firmly above $80. However, the price could also decline.
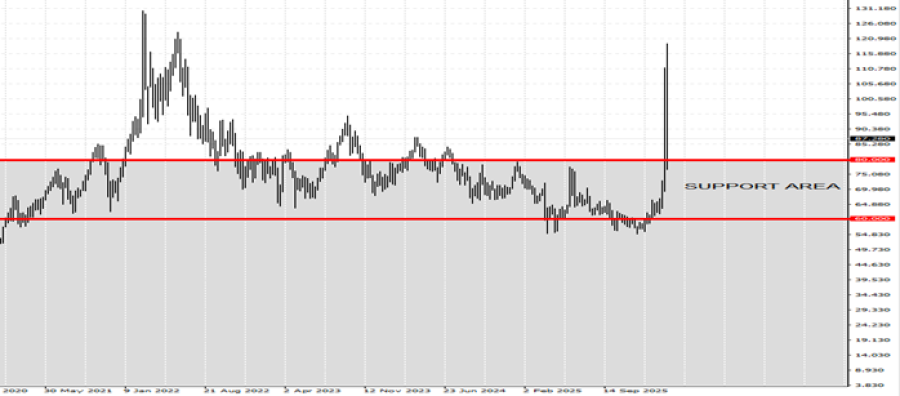
GRAPH (Weekly): November 2020 – March 2026
Please note that past performance does not guarantee future results
Crude Oil, March 11, 2026
Current Price: 86
|
Crude Oil |
Weekly |
|
Trend direction |
|
|
120 |
|
|
110 |
|
|
100 |
|
|
74 |
|
|
73 |
|
|
72 |
Example of calculation based on weekly trend direction for 1.00 Lot1
|
Crude Oil |
||||||
|
Pivot Points |
||||||
|
Profit or loss in $ |
34,000 |
24,000 |
14,000 |
-12,000 |
-13,000 |
-14,000 |
|
Profit or loss in €² |
29,310 |
20,690 |
12,069 |
-10,345 |
-11,207 |
-12,069 |
|
Profit or loss in £² |
25,275 |
17,841 |
10,407 |
-8,921 |
-9,664 |
-10,407 |
|
Profit or loss in C$² |
46,138 |
32,568 |
18,998 |
-16,284 |
-17,641 |
-18,998 |
1. 1.00 lot is equivalent of 1000 units
2. Calculations for exchange rate used a 10:10 (GMT) 11/03/2026
There is a possibility to use Stop-Loss and Take-Profit.
- You may wish to consider closing your position in profit, even if it is lower than the suggested one.
- Trailing stop techniques could protect the profit.