Crude Oil weekly special report based on 1.00 Lot Calculation:
GEOPOLITICS: MIDDLE EAST TENSIONS KEEP MARKETS NERVOUS
- MAY 7: ISRAEL FORCES ATTACK RAFAH, TAKING CONTROL OF THE CROSSING BETWEEN GAZA AND EGYPT. According to Reuters, Israeli tanks and planes attacked several areas and houses in Rafah. The Israeli military took control of the vital Rafah border crossing between Gaza and Egypt on Tuesday (May 7). Earlier, the Israeli forces began evacuation of the Gazans in Rafah in preparation for an invasion. Israel’s military intends to direct a significant portion of Rafah’s population of 1.4 million toward humanitarian islands in central Gaza ahead of Israel’s planned ground offensive.
- CRUDE OIL PRICE REACTION TO ISRAEL- HAMAS WAR SINCE OCTOBER 7, 2023:
|
CRUDE OIL |
|||
|
PERIOD |
NEWS |
PRICE CHANGE % |
PRICE CHANGE $ |
|
OCTOBER 7, 2023 - OCTOBER 20, 2023 |
WAR STARTS BETWEEN ISRAEL AND IRAN-BACKED HAMAS |
8.47% |
$ 7.08 |
|
FEBRUARY 5, 2024 - MARCH 1, 2024 |
ESCALATION AS ISRAEL PREPARES A PLAN TO INVADE RAFAH |
12.25% |
$ 8.82 |
|
APRIL 1, 2024 - APRIL 12, 2024 |
ISRAEL - IRAN WAR CONFLICT WITH STATE-TO-STATE ATTACKS |
7.23% |
$ 5.91 |
NEWS SOURCE: BLOOMBERG
PRICE DATA SOURCE: META TRADER 4 PLATFORM
Please note that past performance does not guarantee future results.
ANALYST EXPECTATIONS
- CITIGROUP: OIL COULD HIT $100 WITHIN THE NEXT 12- 18 MONTHS. According to CNBC, the catalysts for oil to hit $100 per barrel include higher geopolitical risks, deeper OPEC+ cuts and supply disruptions from key oil-producing regions.
- GOLDMAN SACHS SEES OIL AT $100 if a more severe conflict between Iran and Israel occurs.
- JP MORGAN SEES OIL AT $100 BY SEPTEMBER. Moscow’s decision to reduce oil output is likely to drive the price of oil to $100 a barrel this year unless other suppliers take action, J.P. Morgan Global Commodities Research said Wednesday in a report.
- BANK OF AMERICA SEES OIL AT $95. According to Yahoo Finance, the bank raised its oil price forecast for several reasons, including increased geopolitical tensions between Western nations and the oil-producing countries of Russia, Iran, and Venezuela.
TECHNICAL ANALYSIS: FORMER RESISTANCE COULD BECOME NEXT SUPPORT
- FORMER RESISTANCE OF $80, COULD BE NEXT SUPPORT OF $80. After breaking above the mark of $80, which used to be strong resistance for a long time, Crude oil prices could see the same level of strong support, as crude oil prices have traded above the mark since late February 2024.
Please note that past performance does not guarantee future results
- CRUDE OIL ABOVE $80: Crude oil has traded above or near the mark of $80 for around two months, finding strong technical support at $80.
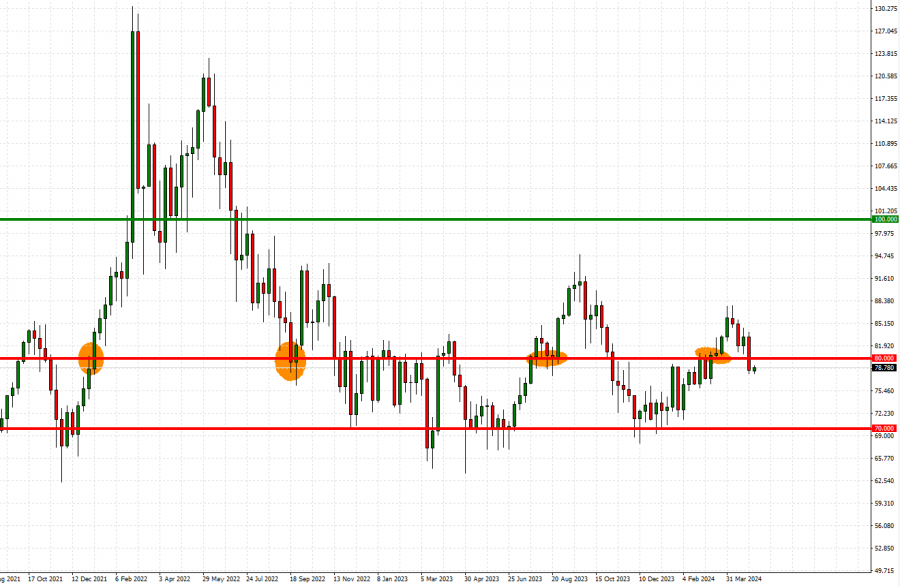
GRAPH: Weekly (October 2021- May 2024)
Please note that past performance does not guarantee future results
Crude Oil, May 7, 2024
Current Price: 78.50
|
Crude Oil |
Weekly |
|
Trend direction |
|
|
100.00 |
|
|
90.00 |
|
|
84.00 |
|
|
74.00 |
|
|
73.50 |
|
|
73.00 |
Example of calculation base on weekly trend direction for 1.00 Lot1
|
Crude Oil |
||||||
|
Pivot Points |
||||||
|
Profit or loss in $ |
21,500 |
11,500 |
5,500 |
-4,500 |
-5,000 |
-5,500 |
|
Profit or loss in €2 |
19,977 |
10,685 |
5,110 |
-4,181 |
-4,646 |
-5,110 |
|
Profit or loss in £2 |
17,148 |
9,172 |
4,387 |
-3,589 |
-3,988 |
-4,387 |
|
Profit or loss in C$2 |
29,406 |
15,729 |
7,523 |
-6,155 |
-6,839 |
-7,523 |
1. 1.00 lot is equivalent of 1000 units
2. Calculations for exchange rate used as of 09:40 (GMT+1) 07/05/2024
Fortrade recommends the use of Stop-Loss and Take-Profit, please speak to your Senior Account ManagerClient Manager regarding their use.
- You may wish to consider closing your position in profit, even if it is lower than suggested one
- Trailing stop technique can protect the profit – Ask your Senior Account ManagerClient Manager for more detail