CRUDE OIL Weekly Special Report based on 1 Lot Calculation:
TECHNICAL ANALYSIS:
- BREAKING NEWS (AUGUST 8): CRUDE OIL PRICES HAVE TESTED THE LOWEST PRICES IN AROUND TWO MONTHS ($63.175).
- SUPPORT AREA: $64.50 - $60.00. Crude oil prices have maintained a strong support zone between $64.00 and $60.00, which has held since April 2025.
- UPTREND (RISING TRENDLINE SUPPORT): An ascending trendline (green line) connects higher lows since April, signaling an uptrend. As long as price holds above this rising line, the market retains a positive momentum. However, if prices fall below the uptrend green line, a negative trend then could develop.
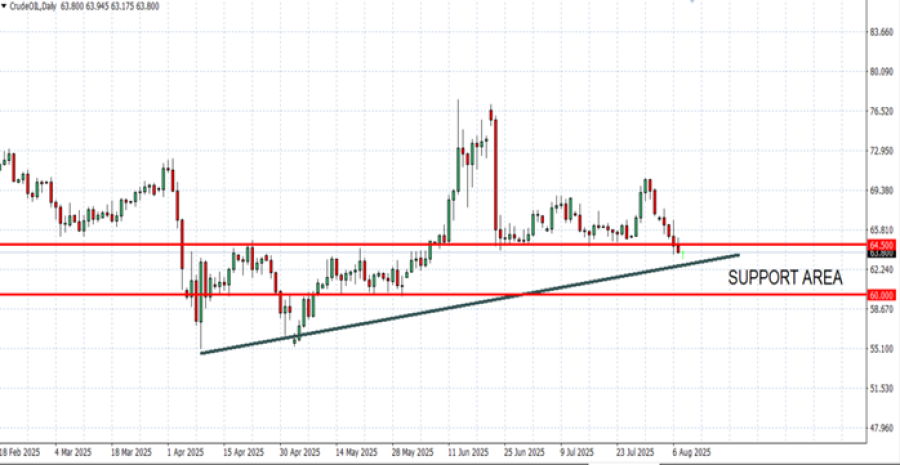
GRAPH (Daily): February 2025 – August 2025
Please note that past performance does not guarantee future results
EVENTS (ECONOMIC CALENDAR):
- TUESDAY, AUGUST 12 AT 21:30 GMT+1: AMERICAN PETROLEUM INSTITUTE (API) WEEKLY OIL INVENTORY DATA (USA). If data showed a declining inventory for the past week, then positive support for the oil price could be expected. However, the price could decline.
- WEDNESDAY, AUGUST 13 AT 15:30 GMT+1: ENERGY INFORMATION ADMINISTRATION (EIA) OIL INVENTORY DATA (USA). If data showed a declining inventory for the past week, then positive support for the oil price could be expected. However, the price could decline.
GEOPOLITICS: TENSIONS RISE BETWEEN THE USA AND RUSSIA
- EVENT (FRIDAY, AUGUST 8): US PRESIDENT DONALD TRUMP THREATENED 100% TARIFFS ON RUSSIAN GOODS AND 100% SECONDARY TARIFFS FOR COUNTRIES THAT BUY RUSSIAN OIL IF NO CEASEFIRE DEAL WITH UKRAINE IS REACHED BY FRIDAY, AUGUST 8. According to Reuters, Trump gave the Russian president a new deadline to make peace or face 100% tariffs on Russian goods, and more importantly, 100% sweeping secondary tariffs, implying that trade sanctions would be imposed on countries that continue importing Russian oil and other commodities.
BREAKING NEWS (AUGUST 6): US PRESIDENT TRUMP ANNOUNCED EXTRA 25% TARIFFS ON INDIA OVER OIL PURCHASES FROM RUSSIA TO MAKE IT TOTAL 50%. India bought around 2 million barrels a day of oil from Russia in June, worth around $4 billion. On an annual basis, on average, this would be equal to near $47 billion. In addition, this would be around 40% of total Russia exports. Latest data also showed that Russia’s oil supplies represent 45% of total oil imports in India.
BREAKING NEWS (AUGUST 6): US PRESIDENT TRUMP THREATENED EXTRA 25% TARIFFS ON CHINA OVER OIL PURCHASES FROM RUSSIA.
RUSSIAN OIL PRODUCTION: Russia produces around 9% of total oil production in the world, or near 10 million barrels a day.
RUSSIAN OIL EXPORTS: Russia’s oil exports of around 5 million barrels a day, representing around 5% of total global consumption.
Crude Oil, August 8, 2025.
Current Price: 63.40
|
Crude Oil |
Weekly |
|
Trend direction |
|
|
70.00 |
|
|
68.00 |
|
|
66.00 |
|
|
61.00 |
|
|
60.50 |
|
|
60.00 |
Example of calculation based on weekly trend direction for 1.00 Lot1
|
Crude Oil |
||||||
|
Pivot Points |
||||||
|
Profit or loss in $ |
6,600 |
4,600 |
2,600 |
-2,400 |
-2,900 |
-3,400 |
|
Profit or loss in €² |
5,660 |
3,945 |
2,230 |
-2,058 |
-2,487 |
-2,916 |
|
Profit or loss in £² |
4,908 |
3,421 |
1,933 |
-1,785 |
-2,156 |
-2,528 |
|
Profit or loss in C$² |
9,060 |
6,314 |
3,569 |
-3,294 |
-3,981 |
-4,667 |
- 1.00 lot is equivalent of 1000 units
- Calculations for exchange rate used as of 09:15 (GMT) 08/08/2025
There is a possibility to use Stop-Loss and Take-Profit.
- You may wish to consider closing your position in profit, even if it is lower than the suggested one.
- Trailing stop techniques could protect the profit.