Crude Oil weekly special report based on 1.00 Lot Calculation:
TECHNICAL ANALYSIS
- SUPPORT AREA: $55 - $60. According to the weekly chart below, crude oil has tested levels between $55 and $60 five times since 2021.
- BREAKING (DECEMBER 16): CRUDE OIL HAS TESTED ITS LOWEST RATE SINCE FEBRUARY 2021 ($54.865). The crude oil price has tested its lowest rate since February 2021. Currently, crude oil is trading above the $61 mark, floating above its longer-term support area between $55 and $60.
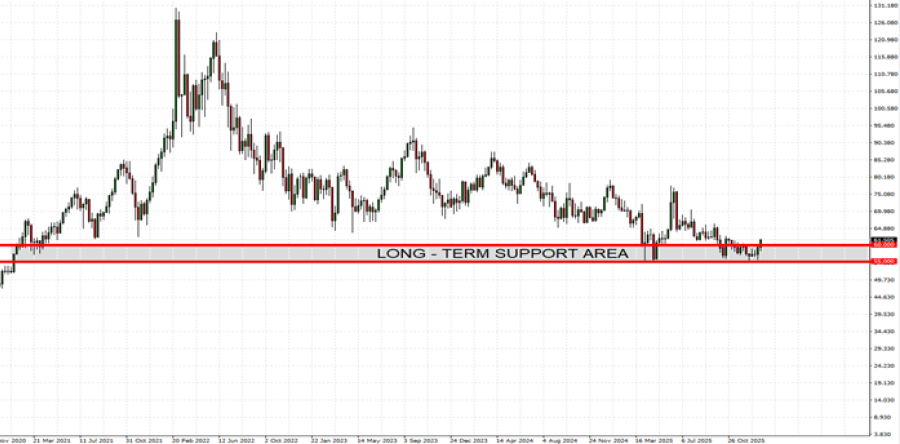
GRAPH (Weekly): March 2021 – January 2026
Please note that past performance does not guarantee future results
GEOPOLITICAL TENSIONS RISE: MIDDLE-EAST
- IRAN: IRANIAN PROTESTS ENTER 18TH DAY AS TRUMP SIGNALS POSSIBLE INTERVENTION (JANUARY 14). Iran faces its 18th consecutive day of nationwide protests, with violent street clashes and authorities cutting internet and international phone access. Protesters are openly calling for the overthrow of Supreme Leader Ayatollah Ali Khamenei and the return of Reza Pahlavi.
IRANIAN OIL PRODUCTION AT RISK: Iran is one of the top three oil producers within OPEC along with Saudi Arabia and Iraq, producing around 4 million barrels of oil per day, which is around 4% of total global supply.
IRAN OIL EXPORTS AT RISK: Iran exports around 1.7 million barrels of oil per day, predominantly to China.
Source: Reuters, CNBC, Bloomberg
OTHER GEOPOLITICS: SUPPLY DISRUPTION FEARS RISE
- VENEZUELA TENSIONS: ELEVEN DAYS AFTER US ARMY ATTACKS VENEZUELA, CAPTURING VENEZUELAN PRESIDENT MADURO (JANUARY 3), THE COUNTRY IS IN DEEP POLITICAL TURMOIL. While some oil exports have started to resume under U.S. oversight, exports to China are expected to fall sharply as tankers avoid seizure due to the blockade and related tanker seizures. Exxon Mobil has declined to commit to major investments in Venezuela under the current legal and political conditions. Meanwhile, the U.S. continues actions to control Venezuela’s oil trade and has filed warrants to seize dozens of oil tankers linked to Venezuelan oil.
- RUSSIA-UKRAINE CONFLICT: DRONES STRUCK FOUR RUSSIAN OIL TANKERS IN THE BLACK SEA NEAR THE NOVOROSSIYSK EXPORT TERMINAL, a key route for Kazakh and Russian crude exports. The attacks raise concerns over potential disruptions to oil supply flows from the region.
EVENTS:
- WEDNESDAY, JANUARY 14 AT 15:30 GMT: ENERGY INFORMATION ADMINISTRATION (EIA) OIL INVENTORY DATA (USA). If data showed a declining inventory for the past week, then positive support for the oil price could be expected. However, the price could decline.
Crude Oil, January 14, 2026
Current Price: 61.50
|
Crude Oil |
Weekly |
|
Trend direction |
|
|
70.00 |
|
|
68.00 |
|
|
65.00 |
|
|
59.00 |
|
|
58.50 |
|
|
58.00 |
Example of calculation based on weekly trend direction for 1.00 Lot1
|
Crude Oil |
||||||
|
Pivot Points |
||||||
|
Profit or loss in $ |
8,500 |
6,500 |
3,500 |
-2,500 |
-3,000 |
-3,500 |
|
Profit or loss in €² |
7,299 |
5,581 |
3,005 |
-2,147 |
-2,576 |
-3,005 |
|
Profit or loss in £² |
6,321 |
4,834 |
2,603 |
-1,859 |
-2,231 |
-2,603 |
|
Profit or loss in C$² |
11,802 |
9,025 |
4,860 |
-3,471 |
-4,165 |
-4,860 |
- 1.00 lot is equivalent of 1000 units
- Calculations for exchange rate used as of 09:30 (GMT) 14/01/2026
There is a possibility to use Stop-Loss and Take-Profit.
- You may wish to consider closing your position in profit, even if it is lower than suggested one.
- Trailing stop technique could protect the profit.