Crude Oil weekly special report based on 1.00 Lot Calculation:
GEOPOLITICS: MIDDLE-EAST
- EVENT (TUESDAY, FEBRUARY 17): IRAN – U.S. NUCLEAR (INDIRECT) TALKS IN GENEVA (SWITZERLAND) TO BE MEDIATED BY OMAN. This comes after the first round of indirect talks between Iran and US took place in Oman on February 6. According to Reuters, The U.S. delegation will be led by envoys Steve Witkoff and Jared Kushner. Iran's Foreign Minister Abbas Araghchi on Sunday left for Geneva. Iran's negotiator reiterated Iran's refusal to discuss a 0% uranium enrichment and its ballistic missile programme with American negotiators, which have been a key demand of Israel and the USA.
IRANIAN OIL PRODUCTION AT RISK: Iran is one of the top three oil producers within OPEC, along with Saudi Arabia and Iraq, producing around 4 million barrels of oil per day, which is around 4% of total global supply.
IRAN OIL EXPORTS AT RISK: Iran exports around 1.7 million barrels of oil per day, predominantly to China.
STRAIT OF HORMUZ AT RISK: KEY OIL SUPPLY ROUTE. The Strait of Hormuz is a critical energy chokepoint through which around 20% of global crude oil demand passes, mainly from Saudi Arabia, Kuwait, and Iran. Rising tensions with Iran increase the risk that Tehran could attempt to block or disrupt traffic through the strait, which would significantly tighten global oil supply and add upside pressure to oil prices.
Source: Reuters, CNBC, Bloomberg
OTHER GEOPOLITICS: RUSSIA-UKRAINE CONFLICT
- EVENT (TUESDAY AND WEDNESDAY, FEBRUARY 17 - 18): ANOTHER ROUND OF A TRI-LATERAL SUMMIT BETWEEN THE USA, UKRAINE AND RUSSIA TO TAKE PLACE IN GENEVA (SWITZERLAND). The previous talks of the trilateral working groups in Abu Dhabi, capital of the UAE, on January 23-24 and February 4-5, did not bring any breakthrough solutions. The main sticking point is the long-term fate of territory in eastern Ukraine, large parts of which Russia has occupied. Moscow is demanding that Kyiv pull its troops out of swaths of the Donbas, including heavily fortified cities that sit atop vast natural resources, as a condition of any deal.
Source: Reuters, CNBC, Bloomberg
OTHER EVENTS:
- WEDNESDAY, FEBRUARY 18 AT 21:30 GMT: AMERICAN PETROLEUM INSTITUTE (API) WEEKLY OIL INVENTORY DATA (USA). If data showed a declining inventory for the past week, then positive support for the oil price could be expected. However, the price could decline.
- THURSDAY, FEBRUARY 19 AT 17:00 GMT: ENERGY INFORMATION ADMINISTRATION (EIA) OIL INVENTORY DATA (USA). If data showed a declining inventory for the past week, then positive support for the oil price could be expected. However, the price could decline.
TECHNICAL ANALYSIS
- SUPPORT AREA: $55 - $60. According to the weekly chart below, crude oil has tested levels between $55 and $60 five times since 2021.
- BREAKING (DECEMBER 16, 2025): CRUDE OIL HAS TESTED ITS LOWEST RATE SINCE FEBRUARY 2021 ($54.865). The crude oil price has tested its lowest rate since February 2021. Currently, crude oil is trading above the $60 mark, floating above its longer-term support area between $55 and $60.
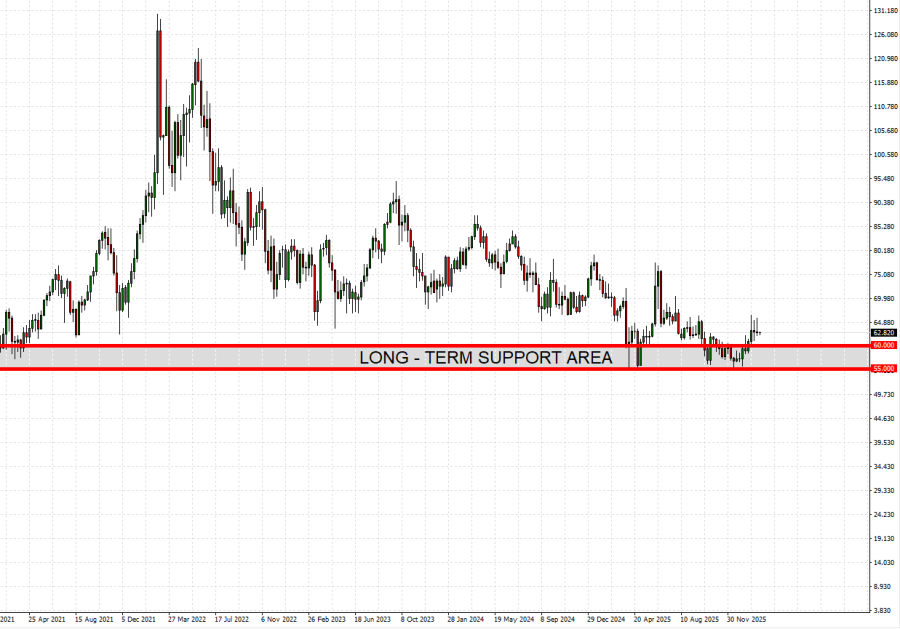
GRAPH (Weekly): April 2021 – February 2026
Please note that past performance does not guarantee future results
Crude Oil, February 16, 2026
Current Price: 62.50
|
Crude Oil |
Weekly |
|
Trend direction |
|
|
75.00 |
|
|
70.00 |
|
|
66.00 |
|
|
59.50 |
|
|
59.00 |
|
|
58.50 |
Example of calculation based on weekly trend direction for 1.00 Lot1
|
Crude Oil |
||||||
|
Pivot Points |
||||||
|
Profit or loss in $ |
12,500 |
7,500 |
3,500 |
-3,000 |
-3,500 |
-4,000 |
|
Profit or loss in €² |
10,536 |
6,322 |
2,950 |
-2,529 |
-2,950 |
-3,372 |
|
Profit or loss in £² |
9,162 |
5,497 |
2,565 |
-2,199 |
-2,565 |
-2,932 |
|
Profit or loss in C$² |
17,017 |
10,210 |
4,765 |
-4,084 |
-4,765 |
-5,445 |
1. 1.00 lot is equivalent of 1000 units
2. Calculations for exchange rate used as of 11:00 (GMT) 16/02/2026
There is a possibility to use Stop-Loss and Take-Profit.
- You may wish to consider closing your position in profit, even if it is lower than suggested one.
- Trailing stop technique could protect the profit.